
- Start >
- Rivers >
- Discharge >
- Isar >
- Bad Wiessee >
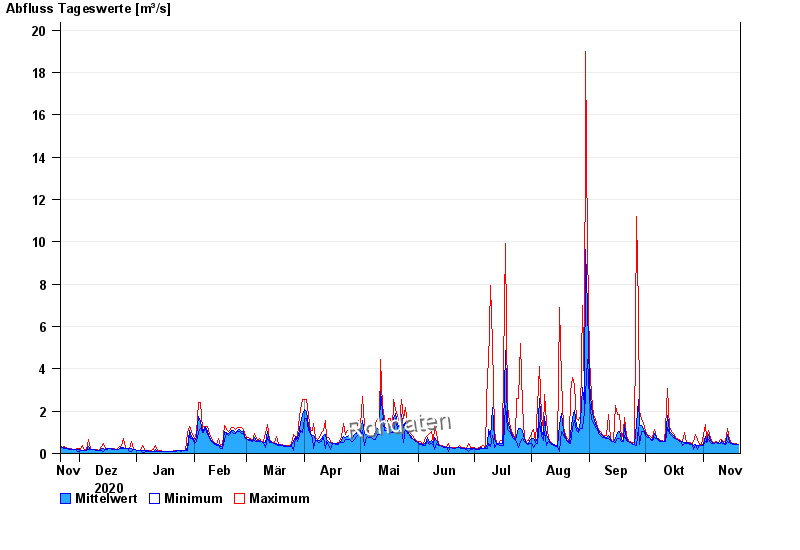
- Chart of year

Chart of year Bad Wiessee / Söllbach
Discharge from 21.11.2020 to 20.11.2021
| Date | Mean value [m³/s] | Maximum [m³/s] | Minimum [m³/s] |
|---|---|---|---|
| 20.11.2021 | 0.409 | 0.409 | 0.409 |
| 19.11.2021 | 0.41 | 0.462 | 0.409 |
| 18.11.2021 | 0.419 | 0.462 | 0.409 |
| 17.11.2021 | 0.46 | 0.462 | 0.409 |
| 16.11.2021 | 0.485 | 0.52 | 0.462 |
| 15.11.2021 | 0.568 | 0.651 | 0.52 |
| 14.11.2021 | 0.879 | 1.18 | 0.582 |
© Bayerisches Landesamt für Umwelt 2024