
- Start >
- Rivers >
- Discharge >
- Isar >
- Bad Wiessee >
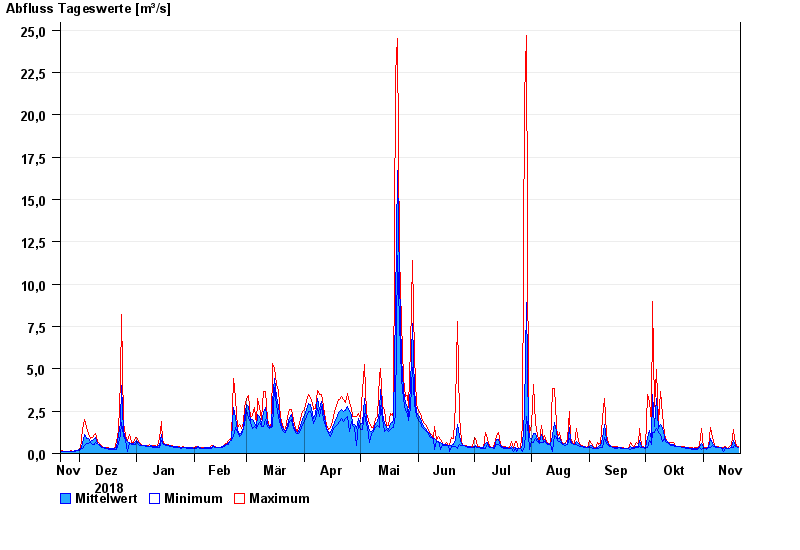
- Chart of year

Chart of year Bad Wiessee / Söllbach
Discharge from 21.11.2018 to 20.11.2019
| Date | Mean value [m³/s] | Maximum [m³/s] | Minimum [m³/s] |
|---|---|---|---|
| 20.11.2019 | 0.373 | 0.394 | 0.346 |
| 19.11.2019 | 0.399 | 0.45 | 0.388 |
| 18.11.2019 | 0.602 | 0.907 | 0.45 |
| 17.11.2019 | 0.784 | 1.44 | 0.369 |
| 16.11.2019 | 0.411 | 0.494 | 0.374 |
| 15.11.2019 | 0.323 | 0.438 | 0.266 |
| 14.11.2019 | 0.314 | 0.32 | 0.272 |
© Bayerisches Landesamt für Umwelt 2024