
- Start >
- Rivers >
- Discharge >
- Isar >
- Bad Wiessee >
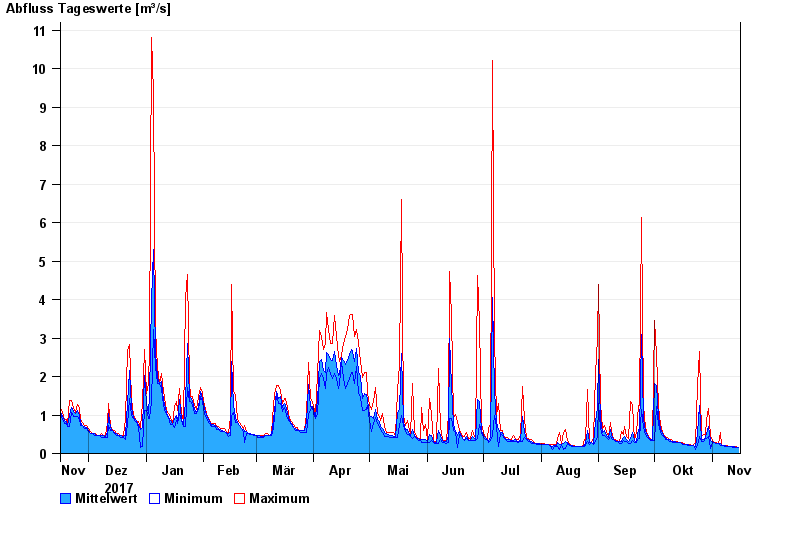
- Chart of year

Chart of year Bad Wiessee / Söllbach
Discharge from 16.11.2017 to 15.11.2018
| Date | Mean value [m³/s] | Maximum [m³/s] | Minimum [m³/s] |
|---|---|---|---|
| 15.11.2018 | 0.162 | 0.163 | 0.162 |
| 14.11.2018 | 0.163 | 0.19 | 0.162 |
| 13.11.2018 | 0.181 | 0.19 | 0.162 |
| 12.11.2018 | 0.189 | 0.19 | 0.162 |
| 11.11.2018 | 0.189 | 0.189 | 0.189 |
| 10.11.2018 | 0.189 | 0.189 | 0.189 |
| 09.11.2018 | 0.19 | 0.22 | 0.189 |
© Bayerisches Landesamt für Umwelt 2024