
- Start >
- Rivers >
- Discharge >
- Isar >
- Bad Wiessee >
- Chart of year

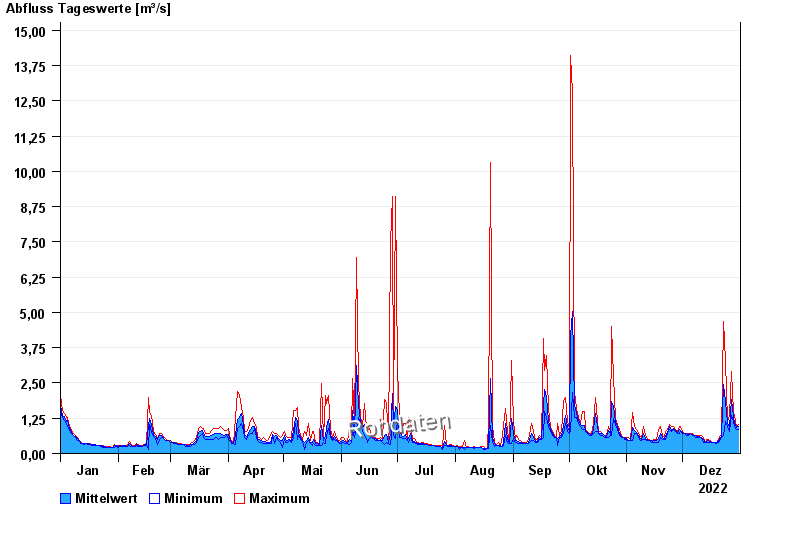
Chart of year Bad Wiessee / Söllbach
Discharge from 01.01.2022 to 31.12.2022
| Date | Mean value [m³/s] | Maximum [m³/s] | Minimum [m³/s] |
|---|---|---|---|
| 31.12.2022 | 0.951 | 1.04 | 0.858 |
| 30.12.2022 | 0.936 | 0.947 | 0.858 |
| 29.12.2022 | 1.08 | 1.36 | 0.947 |
| 28.12.2022 | 1.3 | 1.47 | 1.14 |
| 27.12.2022 | 1.92 | 2.91 | 1.36 |
| 26.12.2022 | 0.927 | 1.36 | 0.777 |
| 25.12.2022 | 1.09 | 1.14 | 0.947 |
© Bayerisches Landesamt für Umwelt 2024