
- Start >
- Rivers >
- Discharge >
- Isar >
- Bad Wiessee >
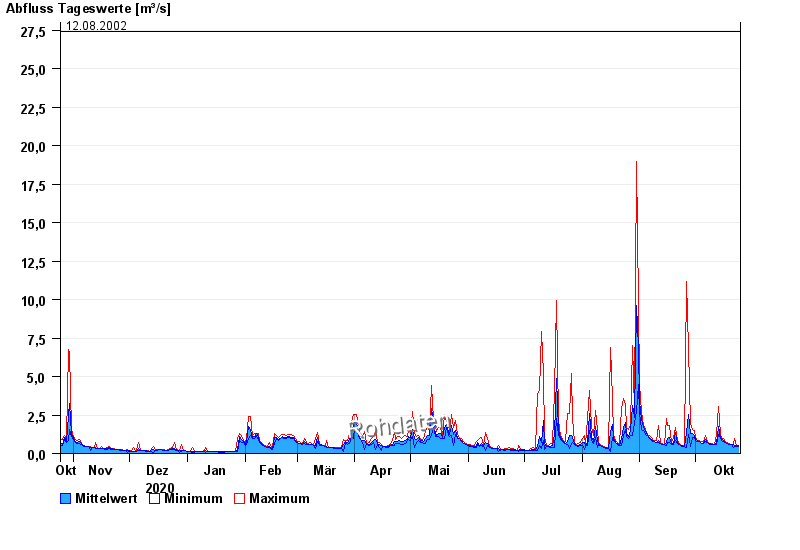
- Chart of year

Chart of year Bad Wiessee / Söllbach
Discharge from 25.10.2020 to 24.10.2021
- 21.05.1999 Abfluss: 44,1 m³/s
- 02.06.2013 Abfluss: 40,5 m³/s
- 23.08.2005 Abfluss: 29,8 m³/s
- 03.06.2010 Abfluss: 28,7 m³/s
- 12.08.2002 Abfluss: 27,4 m³/s
| Date | Mean value [m³/s] | Maximum [m³/s] | Minimum [m³/s] |
|---|---|---|---|
| 24.10.2021 | 0.517 | 0.52 | 0.462 |
| 23.10.2021 | 0.519 | 0.52 | 0.462 |
| 22.10.2021 | 0.538 | 0.978 | 0.462 |
| 21.10.2021 | 0.565 | 0.582 | 0.36 |
| 20.10.2021 | 0.582 | 0.582 | 0.582 |
| 19.10.2021 | 0.602 | 0.651 | 0.582 |
| 18.10.2021 | 0.662 | 0.723 | 0.651 |
© Bayerisches Landesamt für Umwelt 2024