
- Start >
- Rivers >
- Discharge >
- Isar >
- Bad Wiessee >
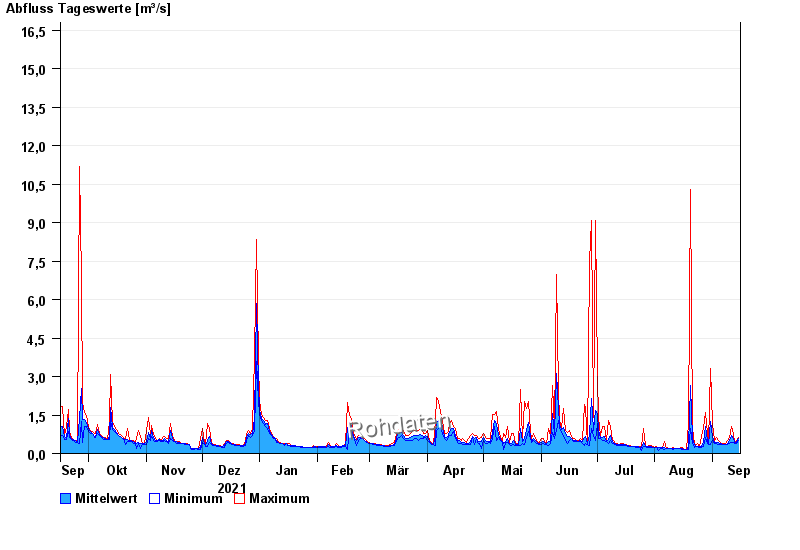
- Chart of year

Chart of year Bad Wiessee / Söllbach
Discharge from 16.09.2021 to 15.09.2022
- 21.05.1999 Abfluss: 44,1 m³/s
- 02.06.2013 Abfluss: 40,5 m³/s
- 23.08.2005 Abfluss: 29,8 m³/s
- 03.06.2010 Abfluss: 28,7 m³/s
- 12.08.2002 Abfluss: 27,4 m³/s
| Date | Mean value [m³/s] | Maximum [m³/s] | Minimum [m³/s] |
|---|---|---|---|
| 15.09.2022 | 0.574 | 0.633 | 0.503 |
| 14.09.2022 | 0.413 | 0.503 | 0.396 |
| 13.09.2022 | 0.428 | 0.448 | 0.396 |
| 12.09.2022 | 0.566 | 0.784 | 0.448 |
| 11.09.2022 | 0.71 | 1.06 | 0.448 |
| 10.09.2022 | 0.495 | 0.633 | 0.396 |
| 09.09.2022 | 0.368 | 0.503 | 0.349 |
© Bayerisches Landesamt für Umwelt 2024