
- Start >
- Rivers >
- Discharge >
- Isar >
- Bad Wiessee >
- Chart of year

Chart of year Bad Wiessee / Söllbach
Discharge from 08.07.2019 to 07.07.2020
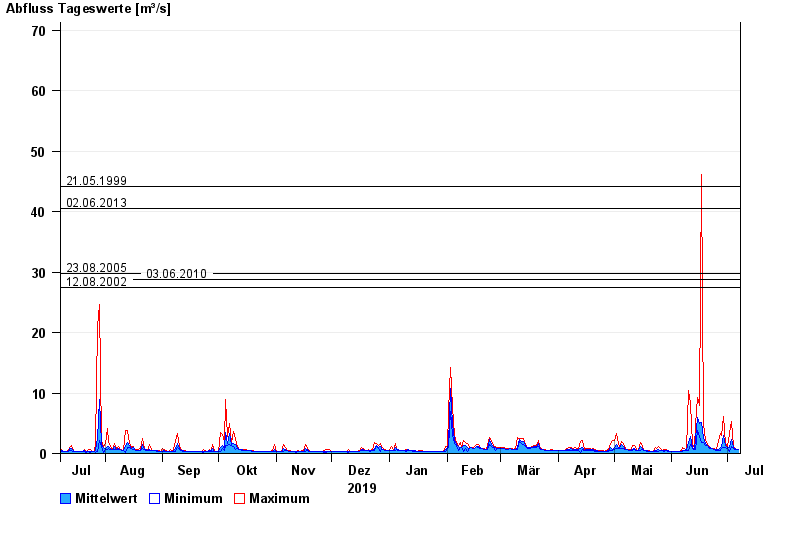
- 21.05.1999 Abfluss: 44,1 m³/s
- 02.06.2013 Abfluss: 40,5 m³/s
- 23.08.2005 Abfluss: 29,8 m³/s
- 03.06.2010 Abfluss: 28,7 m³/s
- 12.08.2002 Abfluss: 27,4 m³/s
| Date | Mean value [m³/s] | Maximum [m³/s] | Minimum [m³/s] |
|---|---|---|---|
| 07.07.2020 | 0.627 | 0.662 | 0.588 |
| 06.07.2020 | 0.682 | 0.74 | 0.662 |
| 05.07.2020 | 0.76 | 0.827 | 0.665 |
| 04.07.2020 | 0.983 | 1.21 | 0.827 |
| 03.07.2020 | 2.29 | 5.33 | 1.21 |
| 02.07.2020 | 0.993 | 3.23 | 0.376 |
| 01.07.2020 | 0.926 | 1.12 | 0.84 |
© Bayerisches Landesamt für Umwelt 2024