
- Start >
- Rivers >
- Discharge >
- Isar >
- Bad Wiessee >
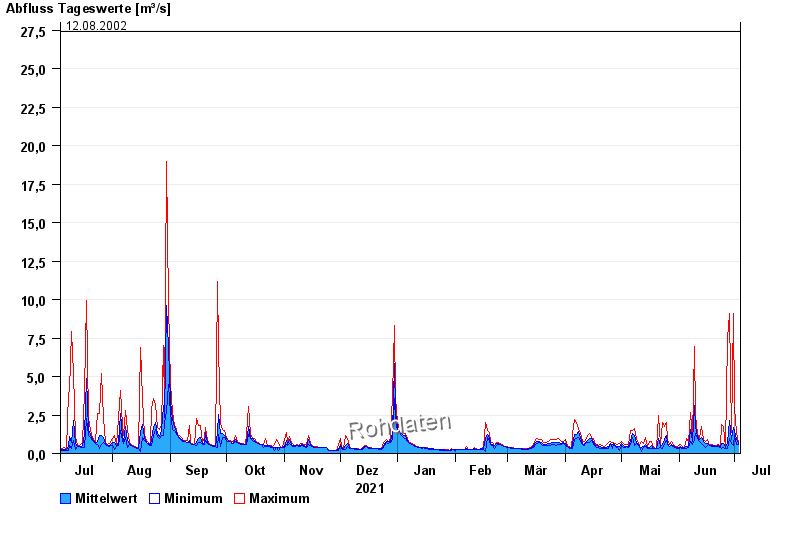
- Chart of year

Chart of year Bad Wiessee / Söllbach
Discharge from 04.07.2021 to 03.07.2022
- 21.05.1999 Abfluss: 44,1 m³/s
- 02.06.2013 Abfluss: 40,5 m³/s
- 23.08.2005 Abfluss: 29,8 m³/s
- 03.06.2010 Abfluss: 28,7 m³/s
- 12.08.2002 Abfluss: 27,4 m³/s
| Date | Mean value [m³/s] | Maximum [m³/s] | Minimum [m³/s] |
|---|---|---|---|
| 03.07.2022 | 0.627 | 0.721 | 0.577 |
| 02.07.2022 | 0.881 | 1.39 | 0.577 |
| 01.07.2022 | 1.51 | 2.99 | 1.18 |
| 30.06.2022 | 1.68 | 9.09 | 0.514 |
| 29.06.2022 | 0.905 | 1.39 | 0.647 |
| 28.06.2022 | 2.13 | 9.09 | 0.98 |
| 27.06.2022 | 0.725 | 7.47 | 0.312 |
© Bayerisches Landesamt für Umwelt 2024