
- Start >
- Rivers >
- Discharge >
- Isar >
- Bad Wiessee >
- Chart of year

Chart of year Bad Wiessee / Söllbach
Discharge from 01.01.2020 to 31.12.2020
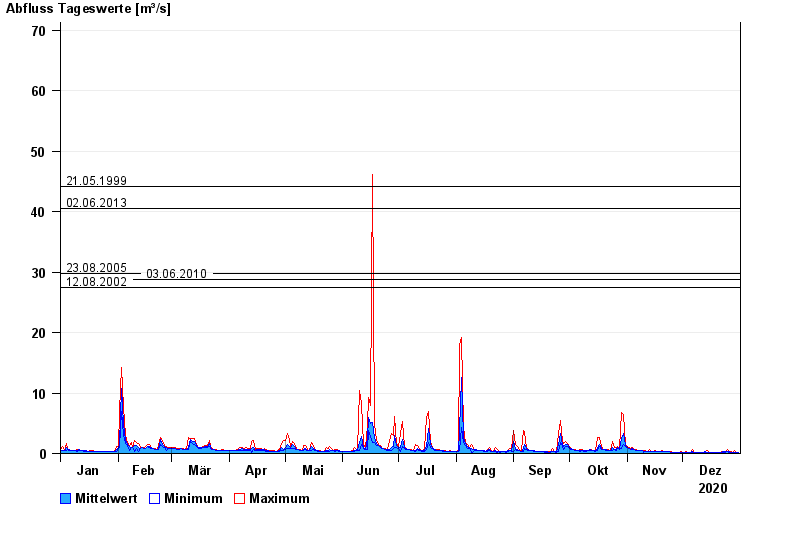
- 21.05.1999 Abfluss: 44,1 m³/s
- 02.06.2013 Abfluss: 40,5 m³/s
- 23.08.2005 Abfluss: 29,8 m³/s
- 03.06.2010 Abfluss: 28,7 m³/s
- 12.08.2002 Abfluss: 27,4 m³/s
| Date | Mean value [m³/s] | Maximum [m³/s] | Minimum [m³/s] |
|---|---|---|---|
| 31.12.2020 | 0.198 | 0.2 | 0.17 |
| 30.12.2020 | 0.199 | 0.227 | 0.196 |
| 29.12.2020 | 0.224 | 0.575 | 0.099 |
| 28.12.2020 | 0.215 | 0.225 | 0.081 |
| 27.12.2020 | 0.225 | 0.257 | 0.22 |
| 26.12.2020 | 0.255 | 0.29 | 0.22 |
| 25.12.2020 | 0.298 | 0.703 | 0.252 |
© Bayerisches Landesamt für Umwelt 2024