
- Start >
- Rivers >
- Discharge >
- Isar >
- Bad Wiessee >
- Chart of month

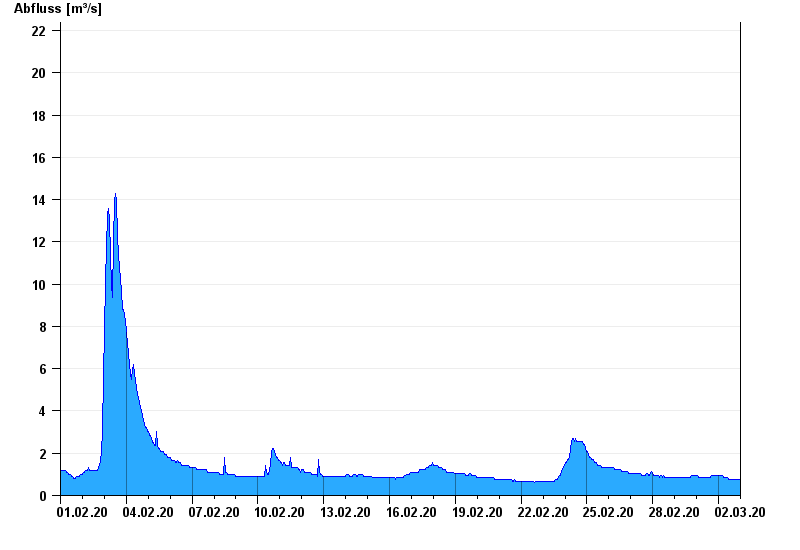
Chart of month Bad Wiessee / Söllbach
Discharge from 01.02.2020 to 02.03.2020
- 21.05.1999 Abfluss: 44,1 m³/s
- 02.06.2013 Abfluss: 40,5 m³/s
- 23.08.2005 Abfluss: 29,8 m³/s
- 03.06.2010 Abfluss: 28,7 m³/s
- 12.08.2002 Abfluss: 27,4 m³/s
| Date | Runoff [m³/s] |
|---|---|
| 02.03.2020 23:45 | 0.762 |
| 02.03.2020 23:30 | 0.762 |
| 02.03.2020 23:15 | 0.762 |
| 02.03.2020 23:00 | 0.762 |
| 02.03.2020 22:45 | 0.762 |
| 02.03.2020 22:30 | 0.762 |
| 02.03.2020 22:15 | 0.762 |
© Bayerisches Landesamt für Umwelt 2024