
- Start >
- Rivers >
- Discharge >
- Isar >
- Bad Wiessee >
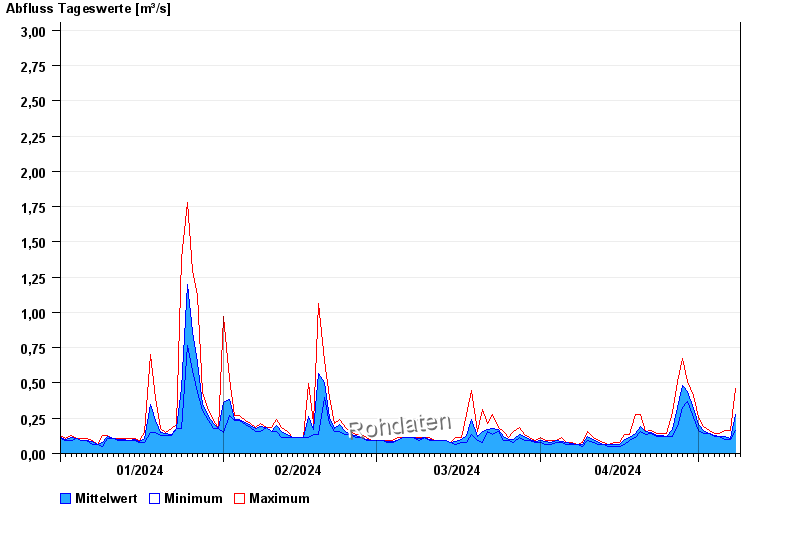
- Chart of year

Chart of year Bad Wiessee / Zeiselbach
Discharge from 01.01.2024 to 08.05.2024
- 10.06.1993 Abfluss: 16 m³/s
- 30.06.1990 Abfluss: 10,1 m³/s
- 13.06.2014 Abfluss: 9,54 m³/s
- 21.05.1999 Abfluss: 9,06 m³/s
- 02.06.2013 Abfluss: 8,89 m³/s
| Date | Mean value [m³/s] | Maximum [m³/s] | Minimum [m³/s] |
|---|---|---|---|
| 08.05.2024 | 0.165 | 0.165 | 0.165 |
| 07.05.2024 | 0.108 | 0.165 | 0.101 |
| 06.05.2024 | 0.12 | 0.165 | 0.101 |
| 05.05.2024 | 0.12 | 0.141 | 0.12 |
| 04.05.2024 | 0.131 | 0.141 | 0.12 |
| 03.05.2024 | 0.141 | 0.165 | 0.141 |
| 02.05.2024 | 0.163 | 0.191 | 0.141 |
© Bayerisches Landesamt für Umwelt 2024