

Chart of year Bad Trißl / Auerbach
Discharge from 29.09.2023 to 28.09.2024
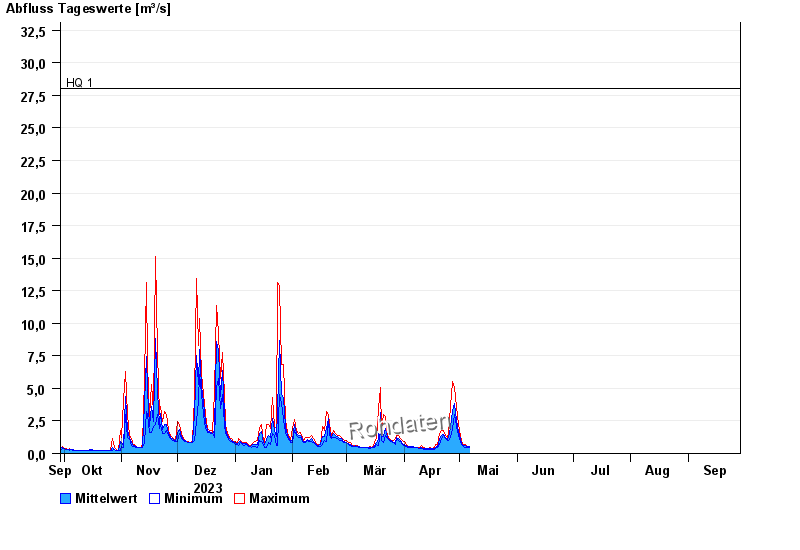
- HQ1 28 m³/s
- HQ2 39 m³/s
- HQ5 53 m³/s
- HQ10 64 m³/s
- HQ20 75 m³/s
- HQ50 90 m³/s
- HQ100 100 m³/s
| Date | Mean value [m³/s] | Maximum [m³/s] | Minimum [m³/s] |
|---|---|---|---|
| 26.04.2024 | 1.4 | 1.64 | 1.25 |
| 25.04.2024 | 1.23 | 1.64 | 1.02 |
| 24.04.2024 | 1.07 | 1.25 | 1.02 |
| 23.04.2024 | 1.2 | 1.37 | 1.13 |
| 22.04.2024 | 1.46 | 1.78 | 1.37 |
| 21.04.2024 | 1.41 | 1.78 | 1.13 |
| 20.04.2024 | 1.1 | 1.5 | 0.724 |
© Bayerisches Landesamt für Umwelt 2024