

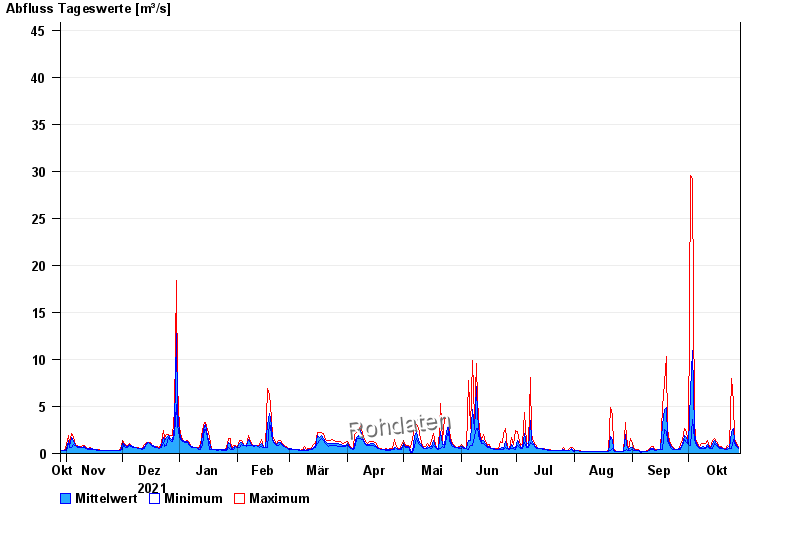
Chart of year Bad Trißl / Auerbach
Discharge from 29.10.2021 to 28.10.2022
- 31.07.1977 Abfluss: 90,6 m³/s
- 21.05.1999 Abfluss: 79 m³/s
- 20.07.1981 Abfluss: 75,8 m³/s
- 12.08.2002 Abfluss: 73,3 m³/s
- 24.08.1955 Abfluss: 70,9 m³/s
| Date | Mean value [m³/s] | Maximum [m³/s] | Minimum [m³/s] |
|---|---|---|---|
| 28.10.2022 | 0.643 | 0.724 | 0.567 |
| 27.10.2022 | 0.836 | 1.02 | 0.724 |
| 26.10.2022 | 1.23 | 1.5 | 1.02 |
| 25.10.2022 | 2.71 | 5.53 | 1.5 |
| 24.10.2022 | 2.39 | 8.01 | 0.498 |
| 23.10.2022 | 0.568 | 0.641 | 0.498 |
| 22.10.2022 | 0.61 | 0.815 | 0.435 |
© Bayerisches Landesamt für Umwelt 2024