

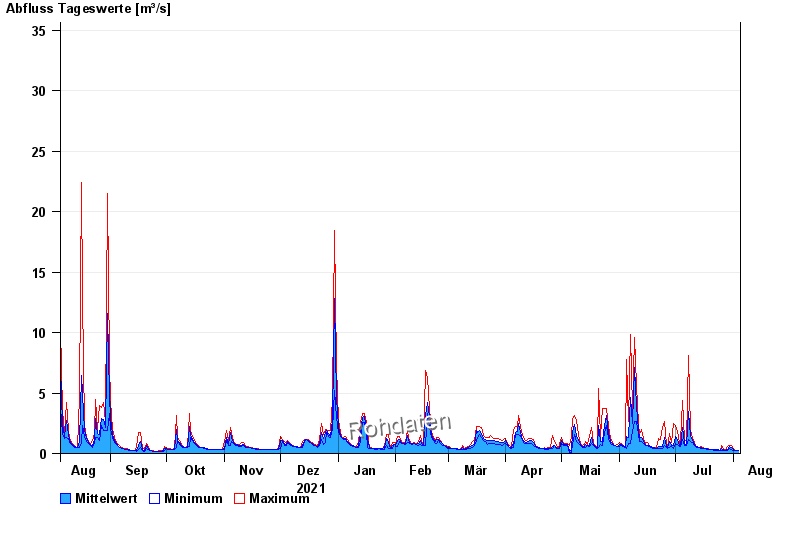
Chart of year Bad Trißl / Auerbach
Discharge from 05.08.2021 to 04.08.2022
- 31.07.1977 Abfluss: 90,6 m³/s
- 21.05.1999 Abfluss: 79 m³/s
- 20.07.1981 Abfluss: 75,8 m³/s
- 12.08.2002 Abfluss: 73,3 m³/s
- 24.08.1955 Abfluss: 70,9 m³/s
| Date | Mean value [m³/s] | Maximum [m³/s] | Minimum [m³/s] |
|---|---|---|---|
| 04.08.2022 | 0.257 | 0.277 | 0.235 |
| 03.08.2022 | 0.277 | 0.277 | 0.277 |
| 02.08.2022 | 0.289 | 0.325 | 0.277 |
| 01.08.2022 | 0.321 | 0.378 | 0.235 |
| 31.07.2022 | 0.464 | 0.65 | 0.325 |
| 30.07.2022 | 0.552 | 0.65 | 0.378 |
| 29.07.2022 | 0.33 | 0.572 | 0.277 |
© Bayerisches Landesamt für Umwelt 2024