

Chart of year Bad Trißl / Auerbach
Discharge from 01.03.2021 to 28.02.2022
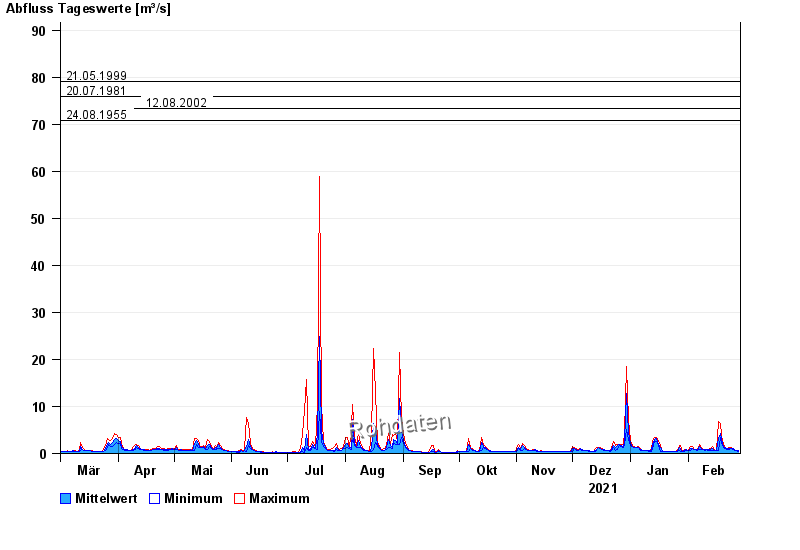
- 31.07.1977 Abfluss: 90,6 m³/s
- 21.05.1999 Abfluss: 79 m³/s
- 20.07.1981 Abfluss: 75,8 m³/s
- 12.08.2002 Abfluss: 73,3 m³/s
- 24.08.1955 Abfluss: 70,9 m³/s
| Date | Mean value [m³/s] | Maximum [m³/s] | Minimum [m³/s] |
|---|---|---|---|
| 28.02.2022 | 0.57 | 0.631 | 0.505 |
| 27.02.2022 | 0.663 | 0.702 | 0.631 |
| 26.02.2022 | 0.796 | 0.865 | 0.702 |
| 25.02.2022 | 0.969 | 1.04 | 0.865 |
| 24.02.2022 | 1.12 | 1.34 | 1.04 |
| 23.02.2022 | 1.12 | 1.34 | 0.865 |
| 22.02.2022 | 0.984 | 1.04 | 0.865 |
© Bayerisches Landesamt für Umwelt 2024