

Chart of year Bad Trißl / Auerbach
Discharge from 25.11.2020 to 24.11.2021
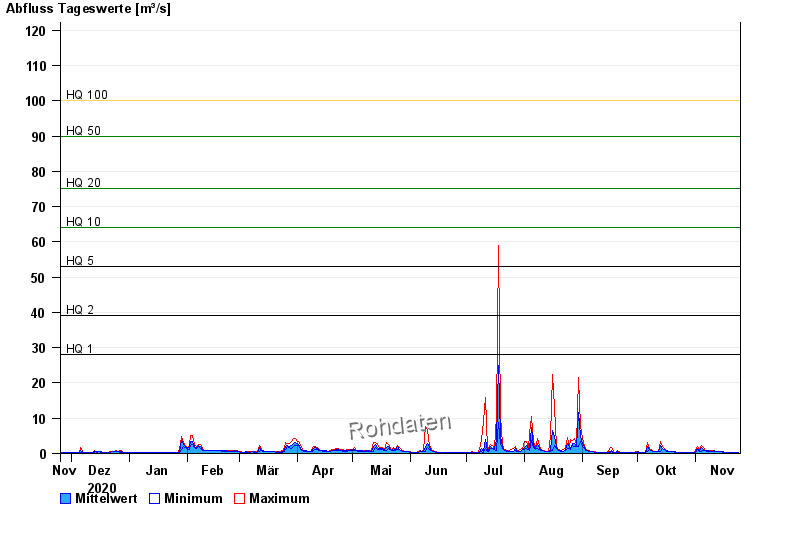
- HQ1 28 m³/s
- HQ2 39 m³/s
- HQ5 53 m³/s
- HQ10 64 m³/s
- HQ20 75 m³/s
- HQ50 90 m³/s
- HQ100 100 m³/s
| Date | Mean value [m³/s] | Maximum [m³/s] | Minimum [m³/s] |
|---|---|---|---|
| 24.11.2021 | 0.325 | 0.325 | 0.325 |
| 23.11.2021 | 0.326 | 0.369 | 0.325 |
| 22.11.2021 | 0.335 | 0.369 | 0.325 |
| 21.11.2021 | 0.334 | 0.369 | 0.325 |
| 20.11.2021 | 0.369 | 0.369 | 0.369 |
| 19.11.2021 | 0.372 | 0.419 | 0.369 |
| 18.11.2021 | 0.374 | 0.419 | 0.369 |
© Bayerisches Landesamt für Umwelt 2024