
- Start >
- Rivers >
- Discharge >
- Isar >
- Bad Tölz KW >
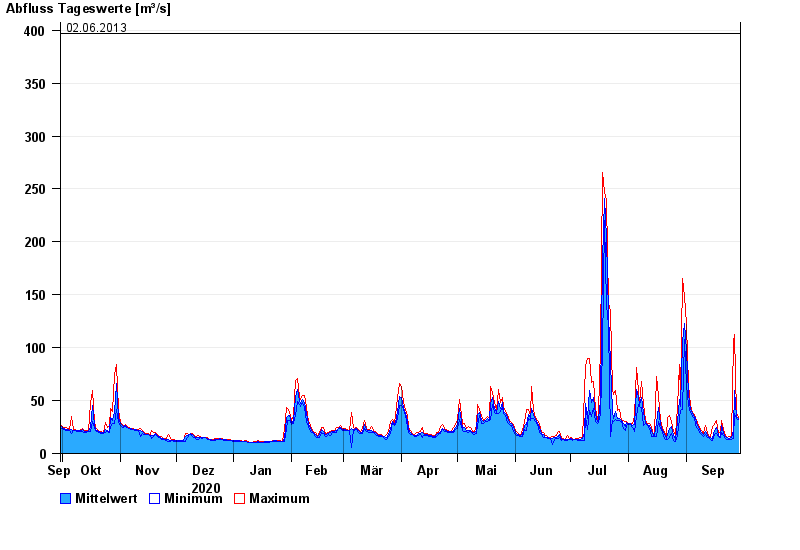
- Chart of year

Chart of year Bad Tölz KW / Isar
Discharge from 30.09.2020 to 29.09.2021
- 23.08.2005 Abfluss: 582 m³/s
- 22.05.1999 Abfluss: 483 m³/s
- 23.07.1966 Abfluss: 472 m³/s
- 11.06.1965 Abfluss: 462 m³/s
- 02.06.2013 Abfluss: 397 m³/s
| Date | Mean value [m³/s] | Maximum [m³/s] | Minimum [m³/s] |
|---|---|---|---|
| 29.09.2021 | 33.1 | 33.8 | 32.5 |
| 28.09.2021 | 35 | 37.7 | 33.3 |
| 27.09.2021 | 59.7 | 112 | 37.7 |
| 26.09.2021 | 21.6 | 105 | 14.6 |
| 25.09.2021 | 14.9 | 16 | 13.7 |
| 24.09.2021 | 14.6 | 15.9 | 13.7 |
| 23.09.2021 | 14.7 | 15.1 | 13.6 |
© Bayerisches Landesamt für Umwelt 2024