

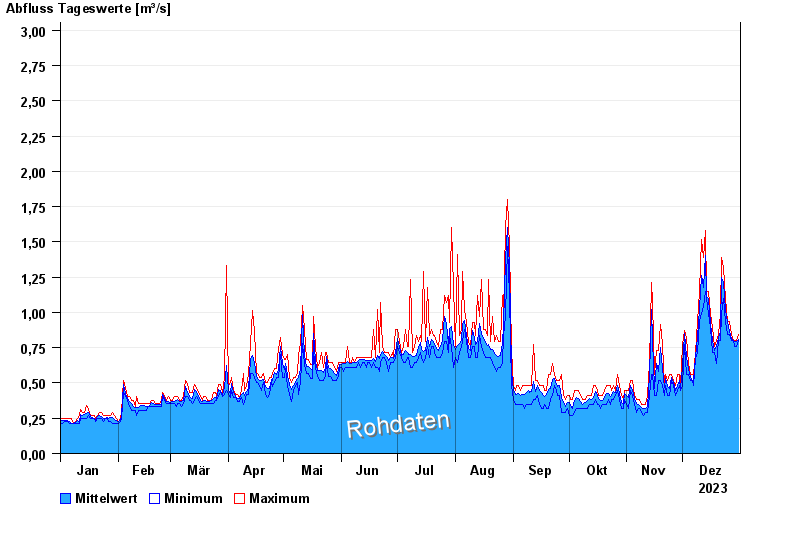
Chart of year Bad Tölz / Ellbach
Discharge from 01.01.2023 to 31.12.2023
- 30.05.1940 Abfluss: 19,8 m³/s
- 23.07.1966 Abfluss: 11,8 m³/s
- 09.07.1954 Abfluss: 11,6 m³/s
- 07.07.1946 Abfluss: 9,23 m³/s
- 21.05.1999 Abfluss: 9,1 m³/s
| Date | Mean value [m³/s] | Maximum [m³/s] | Minimum [m³/s] |
|---|---|---|---|
| 31.12.2023 | 0.809 | 0.845 | 0.8 |
| 30.12.2023 | 0.795 | 0.8 | 0.756 |
| 29.12.2023 | 0.796 | 0.8 | 0.756 |
| 28.12.2023 | 0.8 | 0.8 | 0.8 |
| 27.12.2023 | 0.818 | 0.845 | 0.8 |
| 26.12.2023 | 0.862 | 0.939 | 0.845 |
| 25.12.2023 | 0.932 | 0.939 | 0.845 |
© Bayerisches Landesamt für Umwelt 2024