

Chart of year Bad Tölz / Ellbach
Discharge from 14.11.2019 to 13.11.2020
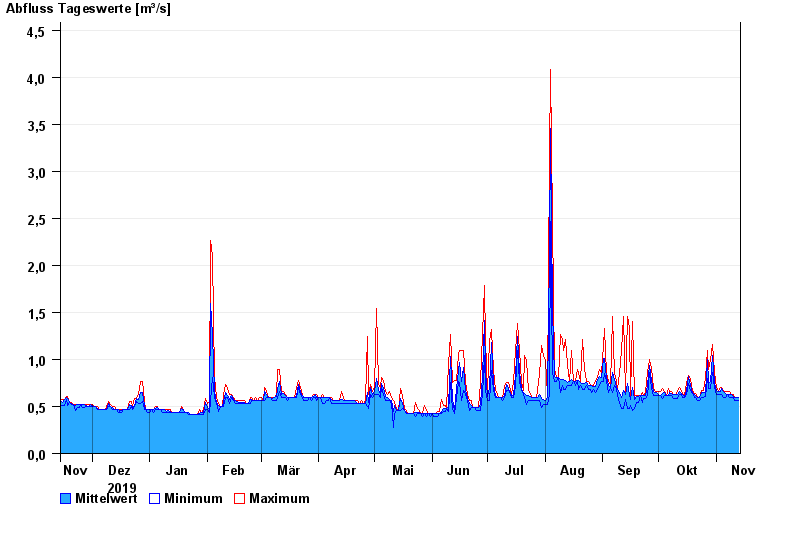
| Date | Mean value [m³/s] | Maximum [m³/s] | Minimum [m³/s] |
|---|---|---|---|
| 13.11.2020 | 0.593 | 0.595 | 0.562 |
| 12.11.2020 | 0.593 | 0.595 | 0.561 |
| 11.11.2020 | 0.593 | 0.594 | 0.561 |
| 10.11.2020 | 0.607 | 0.628 | 0.594 |
| 09.11.2020 | 0.626 | 0.628 | 0.594 |
| 08.11.2020 | 0.628 | 0.663 | 0.593 |
| 07.11.2020 | 0.629 | 0.663 | 0.627 |
© Bayerisches Landesamt für Umwelt 2024