

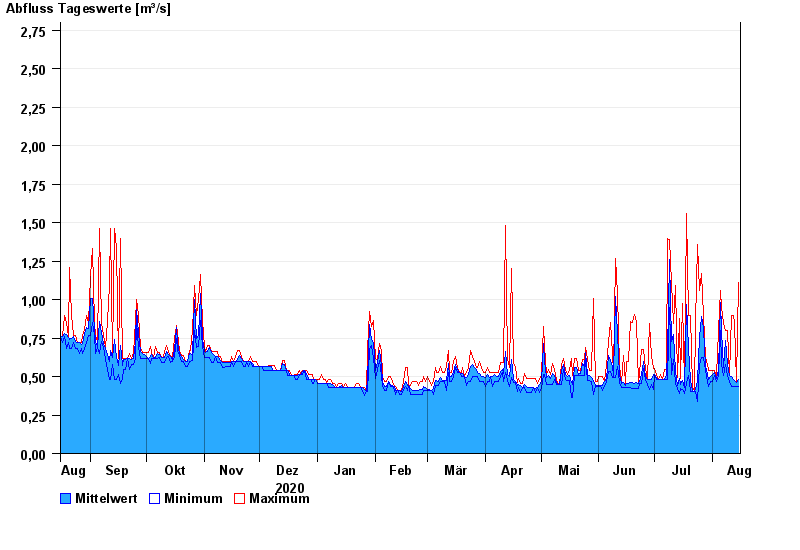
Chart of year Bad Tölz / Ellbach
Discharge from 16.08.2020 to 15.08.2021
- 30.05.1940 Abfluss: 19,8 m³/s
- 23.07.1966 Abfluss: 11,8 m³/s
- 09.07.1954 Abfluss: 11,6 m³/s
- 07.07.1946 Abfluss: 9,23 m³/s
- 21.05.1999 Abfluss: 9,1 m³/s
| Date | Mean value [m³/s] | Maximum [m³/s] | Minimum [m³/s] |
|---|---|---|---|
| 15.08.2021 | 0.48 | 1.11 | 0.434 |
| 14.08.2021 | 0.463 | 0.469 | 0.434 |
| 13.08.2021 | 0.473 | 0.847 | 0.434 |
| 12.08.2021 | 0.482 | 0.897 | 0.434 |
| 11.08.2021 | 0.498 | 0.897 | 0.434 |
| 10.08.2021 | 0.504 | 0.505 | 0.469 |
| 09.08.2021 | 0.575 | 0.799 | 0.505 |
© Bayerisches Landesamt für Umwelt 2024