

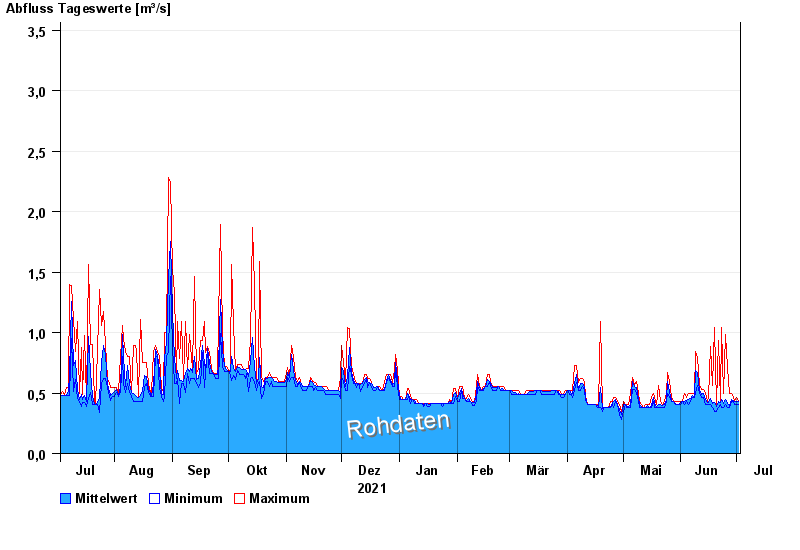
Chart of year Bad Tölz / Ellbach
Discharge from 03.07.2021 to 02.07.2022
- 30.05.1940 Abfluss: 19,8 m³/s
- 23.07.1966 Abfluss: 11,8 m³/s
- 09.07.1954 Abfluss: 11,6 m³/s
- 07.07.1946 Abfluss: 9,23 m³/s
- 21.05.1999 Abfluss: 9,1 m³/s
| Date | Mean value [m³/s] | Maximum [m³/s] | Minimum [m³/s] |
|---|---|---|---|
| 02.07.2022 | 0.431 | 0.432 | 0.404 |
| 01.07.2022 | 0.432 | 0.462 | 0.404 |
| 30.06.2022 | 0.429 | 0.432 | 0.404 |
| 29.06.2022 | 0.441 | 0.462 | 0.432 |
| 28.06.2022 | 0.45 | 0.494 | 0.432 |
| 27.06.2022 | 0.397 | 0.494 | 0.377 |
| 26.06.2022 | 0.415 | 0.711 | 0.377 |
© Bayerisches Landesamt für Umwelt 2024