
- Start >
- Rivers >
- Discharge >
- Isar >
- Bad Feilnbach >
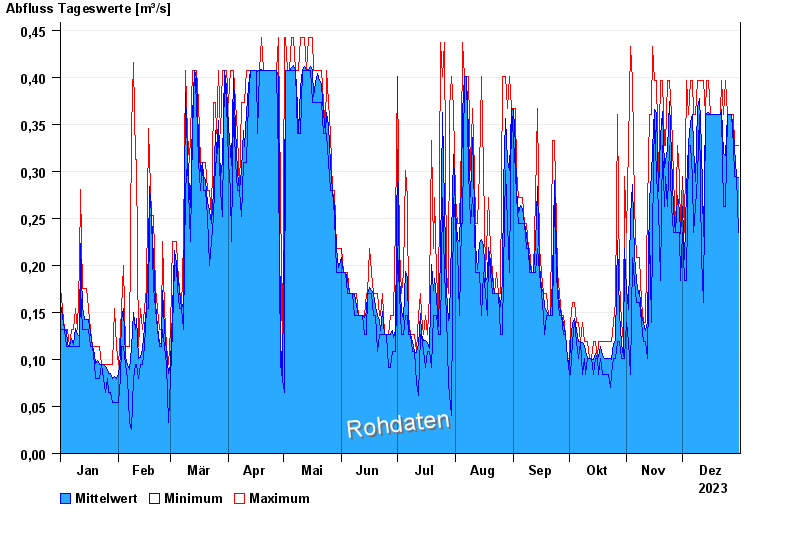
- Chart of year

Chart of year Bad Feilnbach / Mühlbach
Discharge from 01.01.2023 to 31.12.2023
- 24.12.1999 Abfluss: 1,56 m³/s
- 14.06.2000 Abfluss: 1,23 m³/s
- 04.09.1999 Abfluss: 1,22 m³/s
- 01.01.2006 Abfluss: 1,16 m³/s
- 06.08.2002 Abfluss: 0,91 m³/s
| Date | Mean value [m³/s] | Maximum [m³/s] | Minimum [m³/s] |
|---|---|---|---|
| 31.12.2023 | 0.293 | 0.327 | 0.235 |
| 30.12.2023 | 0.294 | 0.327 | 0.294 |
| 29.12.2023 | 0.325 | 0.327 | 0.294 |
| 28.12.2023 | 0.34 | 0.36 | 0.327 |
| 27.12.2023 | 0.36 | 0.36 | 0.36 |
| 26.12.2023 | 0.36 | 0.36 | 0.36 |
| 25.12.2023 | 0.36 | 0.36 | 0.36 |
© Bayerisches Landesamt für Umwelt 2024