
- Start >
- Rivers >
- Discharge >
- Isar >
- Bad Feilnbach >
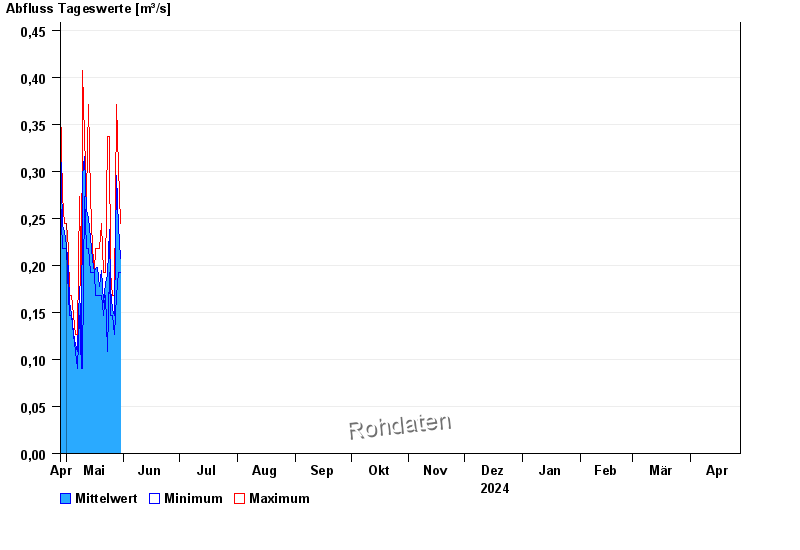
- Chart of year

Chart of year Bad Feilnbach / Mühlbach
Discharge from 28.04.2024 to 27.04.2025
 Für diesen Pegel sind keine Jährlichkeiten hinterlegt.
| Date | Mean value [m³/s] | Maximum [m³/s] | Minimum [m³/s] |
|---|---|---|---|
| 08.05.2024 | 0.19 | 0.273 | 0.147 |
| 07.05.2024 | 0.108 | 0.126 | 0.09 |
| 06.05.2024 | 0.116 | 0.126 | 0.108 |
| 05.05.2024 | 0.128 | 0.147 | 0.126 |
| 04.05.2024 | 0.149 | 0.168 | 0.147 |
| 03.05.2024 | 0.16 | 0.168 | 0.147 |
| 02.05.2024 | 0.194 | 0.218 | 0.168 |
© Bayerisches Landesamt für Umwelt 2024