
- Start >
- Rivers >
- Discharge >
- Isar >
- Bad Feilnbach >
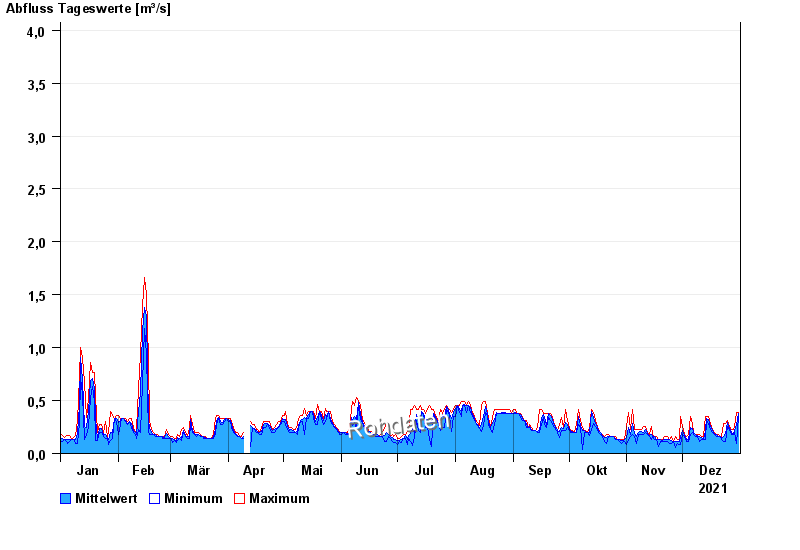
- Chart of year

Chart of year Bad Feilnbach / Mühlbach
Discharge from 01.01.2021 to 31.12.2021
 Für diesen Pegel sind keine Jährlichkeiten hinterlegt.
| Date | Mean value [m³/s] | Maximum [m³/s] | Minimum [m³/s] |
|---|---|---|---|
| 31.12.2021 | 0.378 | 0.383 | 0.349 |
| 30.12.2021 | 0.276 | 0.383 | 0.098 |
| 29.12.2021 | 0.22 | 0.256 | 0.203 |
| 28.12.2021 | 0.183 | 0.228 | 0.178 |
| 27.12.2021 | 0.201 | 0.228 | 0.178 |
| 26.12.2021 | 0.239 | 0.256 | 0.228 |
| 25.12.2021 | 0.297 | 0.316 | 0.256 |
© Bayerisches Landesamt für Umwelt 2024