
- Start >
- Rivers >
- Discharge >
- Isar >
- Bad Feilnbach >
- Chart of year

Chart of year Bad Feilnbach / Jenbach
Discharge from 01.01.2024 to 31.12.2024
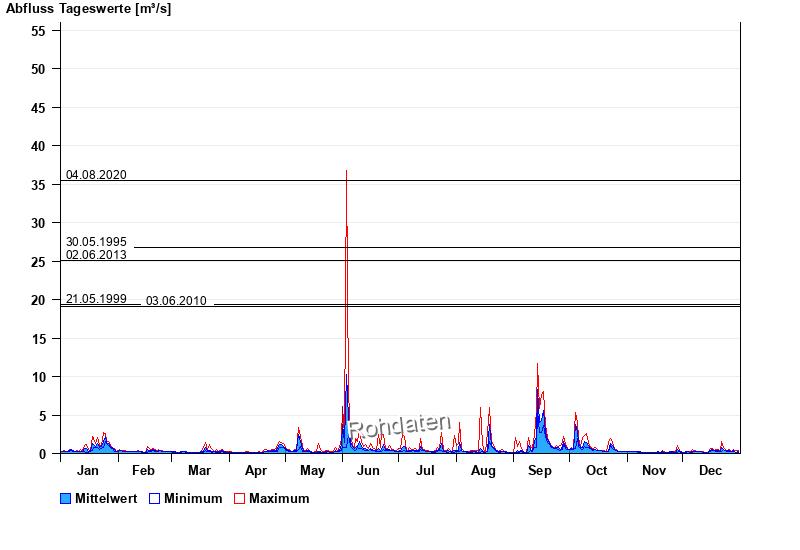
- 04.08.2020 Abfluss: 34,4 m³/s
- 30.05.1995 Abfluss: 26,8 m³/s
- 02.06.2013 Abfluss: 25,1 m³/s
- 21.05.1999 Abfluss: 19,4 m³/s
- 03.06.2010 Abfluss: 19,1 m³/s
| Date | Mean value [m³/s] | Maximum [m³/s] | Minimum [m³/s] |
|---|---|---|---|
| 29.05.2024 | 0.313 | 0.313 | 0.313 |
| 28.05.2024 | 0.407 | 0.753 | 0.195 |
| 27.05.2024 | 0.15 | 0.221 | 0.13 |
| 26.05.2024 | 0.168 | 0.195 | 0.15 |
| 25.05.2024 | 0.191 | 0.221 | 0.15 |
| 24.05.2024 | 0.268 | 0.387 | 0.195 |
| 23.05.2024 | 0.23 | 0.429 | 0.15 |
© Bayerisches Landesamt für Umwelt 2024