
- Start >
- Rivers >
- Discharge >
- Isar >
- Bad Aibling >
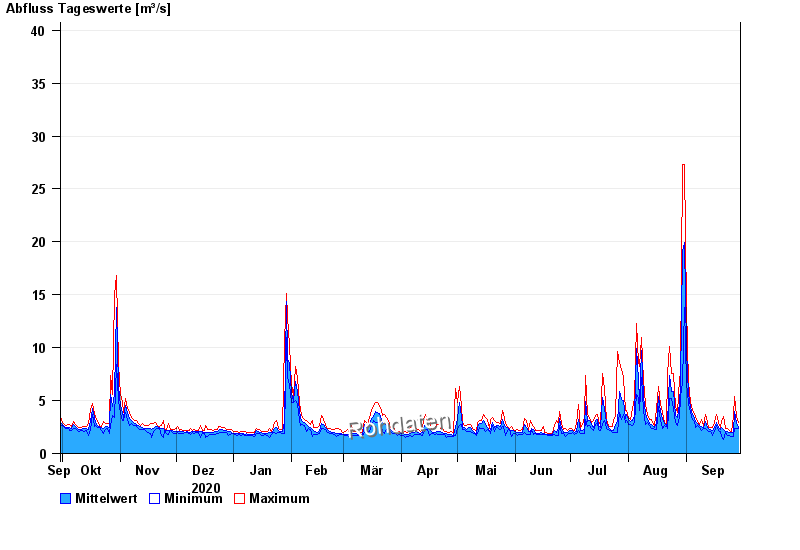
- Chart of year

Chart of year Bad Aibling / Glonn
Discharge from 30.09.2020 to 29.09.2021
- 04.08.2020 Abfluss: 74,5 m³/s
- 03.06.2013 Abfluss: 70,5 m³/s
- 31.05.1940 Abfluss: 64,1 m³/s
- 07.07.1946 Abfluss: 57 m³/s
- 09.07.1954 Abfluss: 54,7 m³/s
| Date | Mean value [m³/s] | Maximum [m³/s] | Minimum [m³/s] |
|---|---|---|---|
| 29.09.2021 | 2.49 | 2.91 | 2.33 |
| 28.09.2021 | 2.83 | 3.54 | 2.33 |
| 27.09.2021 | 3.95 | 5.34 | 2.33 |
| 26.09.2021 | 1.97 | 3.54 | 1.64 |
| 25.09.2021 | 1.94 | 2.08 | 1.64 |
| 24.09.2021 | 1.98 | 2.21 | 1.74 |
| 23.09.2021 | 2.05 | 2.33 | 1.74 |
© Bayerisches Landesamt für Umwelt 2024