
- Start >
- Rivers >
- Discharge >
- Isar >
- Bad Aibling >
- Chart of year

Chart of year Bad Aibling / Glonn
Discharge from 01.12.2023 to 30.11.2024
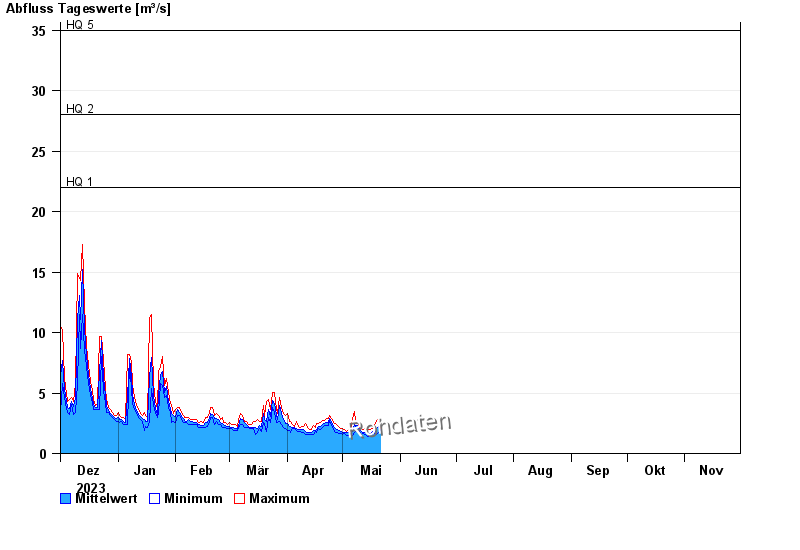
- HQ1 22 m³/s
- HQ2 28 m³/s
- HQ5 35 m³/s
- HQ10 43 m³/s
- HQ20 52 m³/s
- HQ50 62 m³/s
- HQ100 70 m³/s
| Date | Mean value [m³/s] | Maximum [m³/s] | Minimum [m³/s] |
|---|---|---|---|
| 14.05.2024 | 1.69 | 1.95 | 1.37 |
| 13.05.2024 | 1.75 | 2.07 | 1.54 |
| 12.05.2024 | 1.76 | 1.95 | 1.64 |
| 11.05.2024 | 1.85 | 2.07 | 1.54 |
| 10.05.2024 | 2.02 | 2.19 | 1.84 |
| 09.05.2024 | 2.31 | 2.45 | 2.19 |
| 08.05.2024 | 2.24 | 2.73 | 1.84 |
© Bayerisches Landesamt für Umwelt 2024