
- Start >
- Rivers >
- Discharge >
- Isar >
- Bad Aibling >
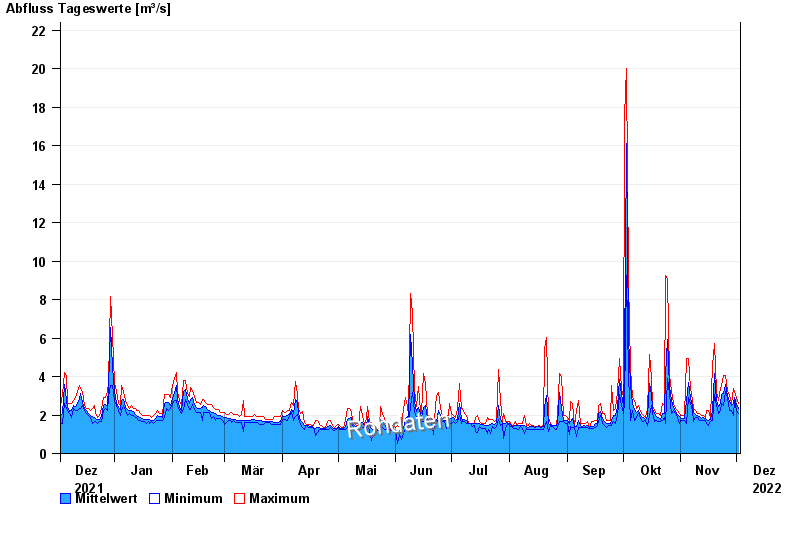
- Chart of year

Chart of year Bad Aibling / Glonn
Discharge from 03.12.2021 to 02.12.2022
| Date | Mean value [m³/s] | Maximum [m³/s] | Minimum [m³/s] |
|---|---|---|---|
| 02.12.2022 | 2.32 | 2.61 | 2.08 |
| 01.12.2022 | 2.54 | 2.91 | 2.21 |
| 30.11.2022 | 2.93 | 3.22 | 2.75 |
| 29.11.2022 | 2.61 | 3.38 | 1.96 |
| 28.11.2022 | 2.47 | 2.61 | 2.21 |
| 27.11.2022 | 2.72 | 3.05 | 2.21 |
| 26.11.2022 | 3.04 | 3.22 | 2.91 |
© Bayerisches Landesamt für Umwelt 2024