
- Start >
- Rivers >
- Discharge >
- Isar >
- Bad Aibling >
- Chart of year

Chart of year Bad Aibling / Glonn
Discharge from 01.12.2023 to 30.11.2024
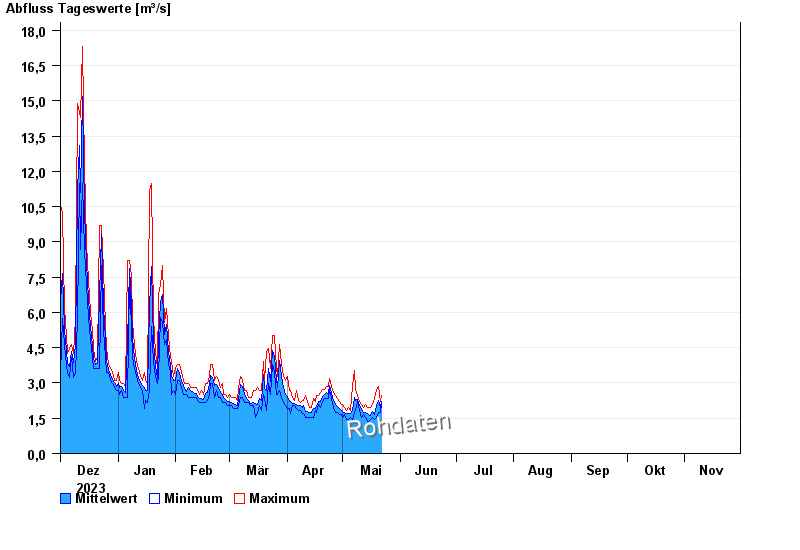
| Date | Mean value [m³/s] | Maximum [m³/s] | Minimum [m³/s] |
|---|---|---|---|
| 06.05.2024 | 1.61 | 1.64 | 1.54 |
| 05.05.2024 | 1.68 | 1.84 | 1.54 |
| 04.05.2024 | 1.71 | 1.95 | 1.45 |
| 03.05.2024 | 1.7 | 1.84 | 1.45 |
| 02.05.2024 | 1.76 | 1.95 | 1.64 |
| 01.05.2024 | 1.77 | 2.07 | 1.54 |
| 30.04.2024 | 1.84 | 2.07 | 1.64 |
© Bayerisches Landesamt für Umwelt 2024