
- Start >
- Rivers >
- Discharge >
- Isar >
- Bad Aibling >
- Chart of year

Chart of year Bad Aibling / Glonn
Discharge from 27.10.2022 to 26.10.2023
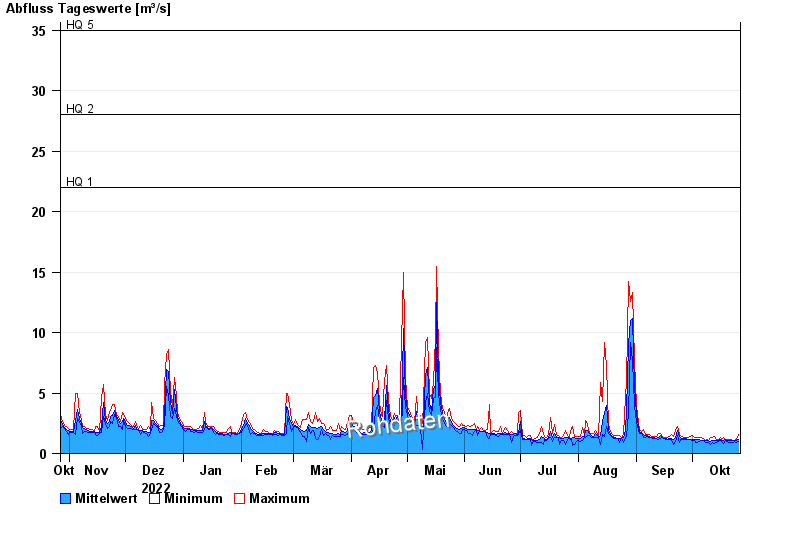
- HQ1 22 m³/s
- HQ2 28 m³/s
- HQ5 35 m³/s
- HQ10 43 m³/s
- HQ20 52 m³/s
- HQ50 62 m³/s
- HQ100 70 m³/s
| Date | Mean value [m³/s] | Maximum [m³/s] | Minimum [m³/s] |
|---|---|---|---|
| 26.10.2023 | 1.12 | 1.57 | 0.999 |
| 25.10.2023 | 1.08 | 1.14 | 0.94 |
| 24.10.2023 | 1.05 | 1.07 | 0.999 |
| 23.10.2023 | 1.06 | 1.07 | 0.94 |
| 22.10.2023 | 1.09 | 1.14 | 0.94 |
| 21.10.2023 | 1.07 | 1.14 | 0.94 |
| 20.10.2023 | 1.08 | 1.14 | 0.999 |
© Bayerisches Landesamt für Umwelt 2024