
- Start >
- Rivers >
- Discharge >
- Isar >
- Bad Aibling >
- Chart of month

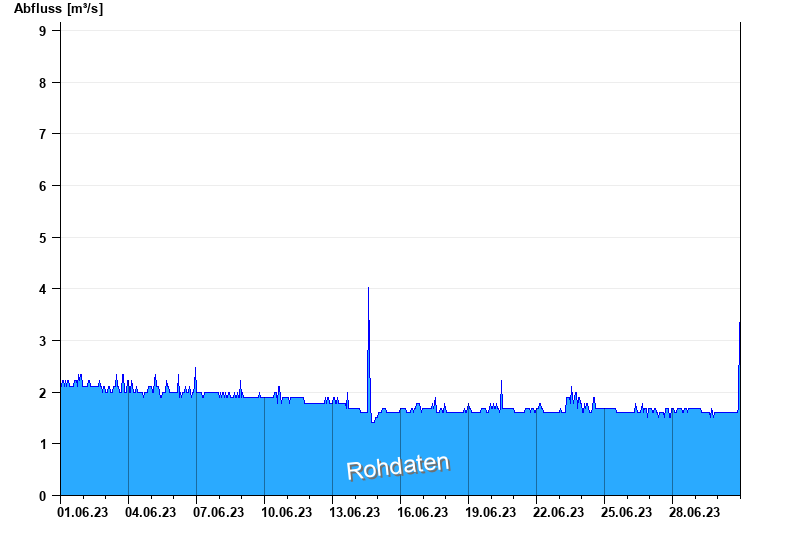
Chart of month Bad Aibling / Glonn
Discharge from 01.06.2023 to 30.06.2023
- HQ1 22 m³/s
- HQ2 28 m³/s
- HQ5 35 m³/s
- HQ10 43 m³/s
- HQ20 52 m³/s
- HQ50 62 m³/s
- HQ100 70 m³/s
| Date | Runoff [m³/s] |
|---|---|
| 01.07.2023 00:45 | 1.89 |
| 01.07.2023 00:30 | 2 |
| 01.07.2023 00:15 | 1.89 |
| 01.07.2023 00:00 | 2.11 |
| 30.06.2023 23:45 | 2.48 |
| 30.06.2023 23:30 | 2.75 |
| 30.06.2023 23:15 | 3.2 |
© Bayerisches Landesamt für Umwelt 2025