
- Start >
- Rivers >
- Discharge >
- Isar >
- Augsburg u. d. Wertachmündung >
- Chart of year

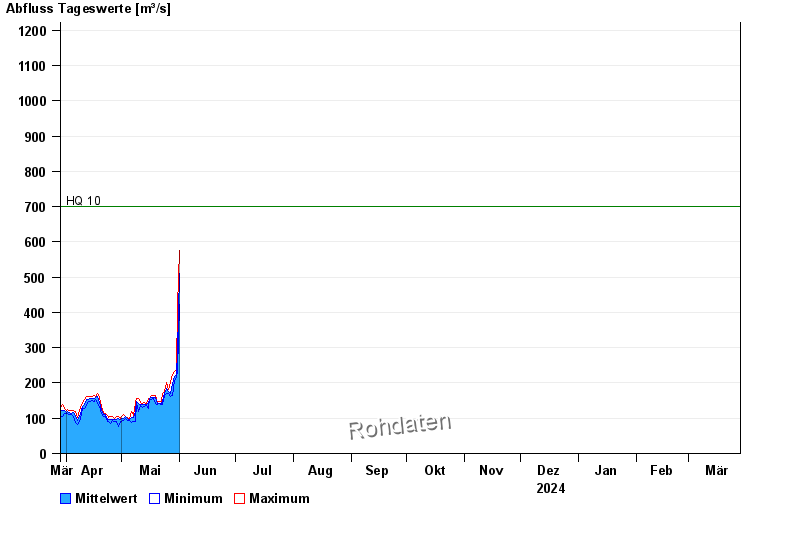
Chart of year Augsburg u. d. Wertachmündung / Lech
Discharge from 29.03.2024 to 28.03.2025
note
Abflussermittlung bei Hochwasser durch Geschiebeverlagerung beeinflusst
- HQ10 700 m³/s
- HQ100 1350 m³/s
| Date | Mean value [m³/s] | Maximum [m³/s] | Minimum [m³/s] |
|---|---|---|---|
| 20.05.2024 | 143 | 145 | 139 |
| 19.05.2024 | 158 | 165 | 143 |
| 18.05.2024 | 160 | 165 | 157 |
| 17.05.2024 | 160 | 165 | 153 |
| 16.05.2024 | 156 | 157 | 155 |
| 15.05.2024 | 143 | 157 | 127 |
| 14.05.2024 | 139 | 143 | 137 |
© Bayerisches Landesamt für Umwelt 2024