
- Start >
- Rivers >
- Discharge >
- Isar >
- Augsburg u. d. Wertachmündung >
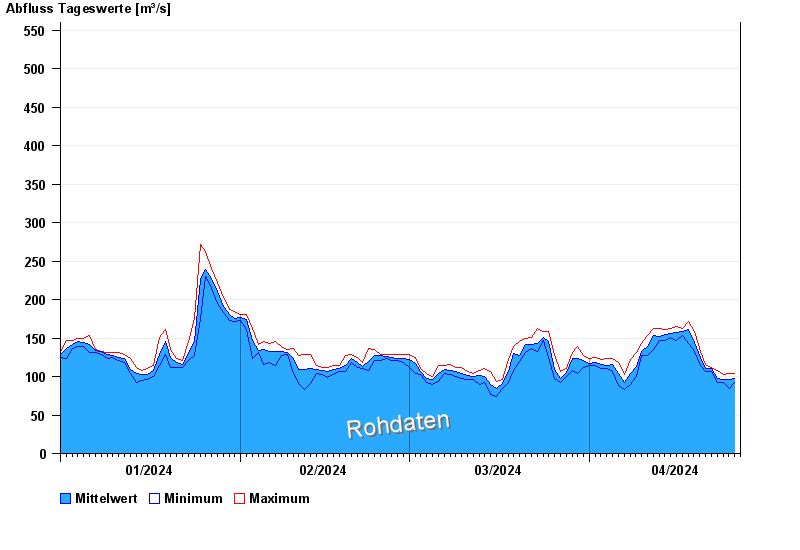
- Chart of year

Chart of year Augsburg u. d. Wertachmündung / Lech
Discharge from 01.01.2024 to 26.04.2024
note
Abflussermittlung bei Hochwasser durch Geschiebeverlagerung beeinflusst
- HQ10 700 m³/s
- HQ100 1350 m³/s
| Date | Mean value [m³/s] | Maximum [m³/s] | Minimum [m³/s] |
|---|---|---|---|
| 26.04.2024 | 103 | 108 | 97.9 |
| 25.04.2024 | 99.6 | 108 | 88.3 |
| 24.04.2024 | 96.1 | 102 | 92.1 |
| 23.04.2024 | 97.5 | 108 | 92.1 |
| 22.04.2024 | 110 | 112 | 106 |
| 21.04.2024 | 110 | 116 | 106 |
| 20.04.2024 | 125 | 133 | 114 |
© Bayerisches Landesamt für Umwelt 2024