
- Start >
- Rivers >
- Discharge >
- Isar >
- Au b. Bad Aibling >
- Chart of year

Chart of year Au b. Bad Aibling / Aubach
Discharge from 09.12.2023 to 08.12.2024
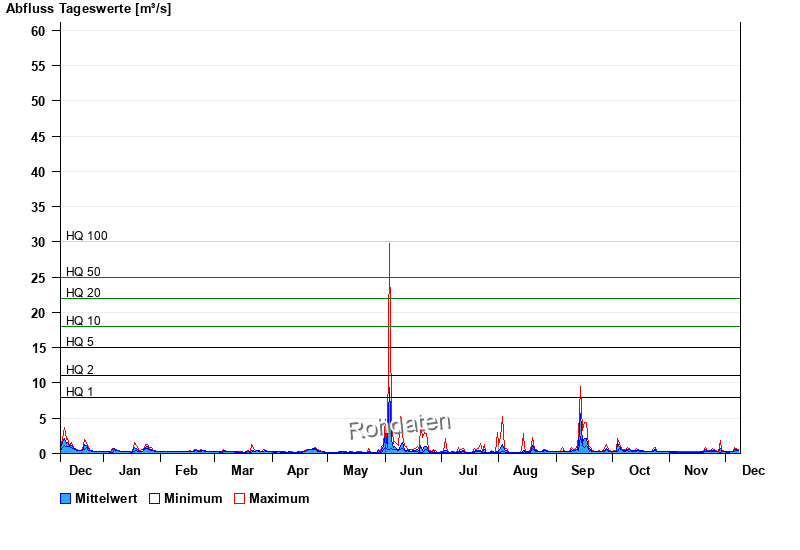
- HQ1 8 m³/s
- HQ2 11 m³/s
- HQ5 15 m³/s
- HQ10 18 m³/s
- HQ20 22 m³/s
- HQ50 25 m³/s
- HQ100 30 m³/s
| Date | Mean value [m³/s] | Maximum [m³/s] | Minimum [m³/s] |
|---|---|---|---|
| 08.12.2024 | 0.488 | 0.548 | 0.437 |
| 07.12.2024 | 0.51 | 0.675 | 0.437 |
| 06.12.2024 | 0.517 | 0.814 | 0.302 |
| 05.12.2024 | 0.317 | 0.343 | 0.302 |
| 04.12.2024 | 0.327 | 0.343 | 0.264 |
| 03.12.2024 | 0.259 | 0.302 | 0.198 |
| 02.12.2024 | 0.217 | 0.264 | 0.198 |
© Bayerisches Landesamt für Umwelt 2025