
- Start >
- Rivers >
- Discharge >
- Isar >
- Au b. Bad Aibling >
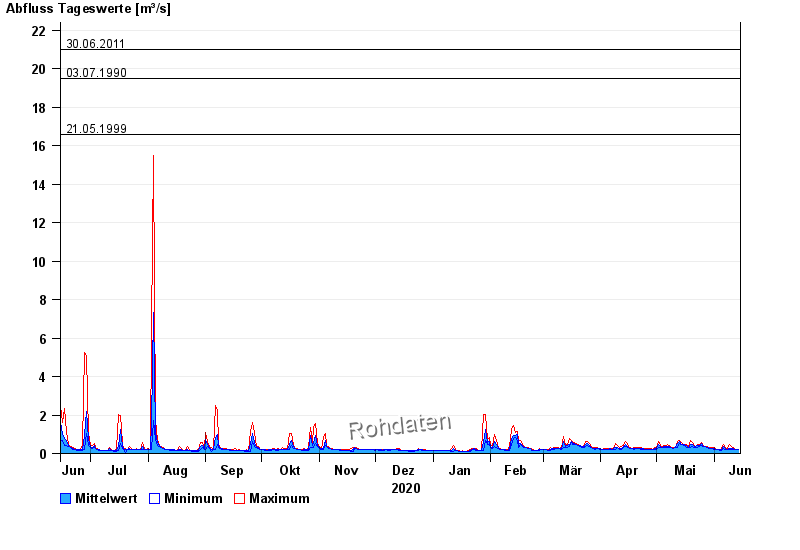
- Chart of year

Chart of year Au b. Bad Aibling / Aubach
Discharge from 15.06.2020 to 14.06.2021
- 21.06.1986 Abfluss: 31,7 m³/s
- 29.05.1995 Abfluss: 22,9 m³/s
- 30.06.2011 Abfluss: 21 m³/s
- 03.07.1990 Abfluss: 19,5 m³/s
- 21.05.1999 Abfluss: 16,6 m³/s
| Date | Mean value [m³/s] | Maximum [m³/s] | Minimum [m³/s] |
|---|---|---|---|
| 14.06.2021 | 0.203 | 0.203 | 0.203 |
| 13.06.2021 | 0.203 | 0.203 | 0.203 |
| 12.06.2021 | 0.221 | 0.268 | 0.203 |
| 11.06.2021 | 0.269 | 0.309 | 0.232 |
| 10.06.2021 | 0.267 | 0.349 | 0.232 |
| 09.06.2021 | 0.254 | 0.488 | 0.203 |
| 08.06.2021 | 0.229 | 0.268 | 0.203 |
© Bayerisches Landesamt für Umwelt 2024