
- Start >
- Rivers >
- Discharge >
- Isar >
- Au b. Bad Aibling >
- Chart of year

Chart of year Au b. Bad Aibling / Aubach
Discharge from 07.08.2020 to 06.08.2021
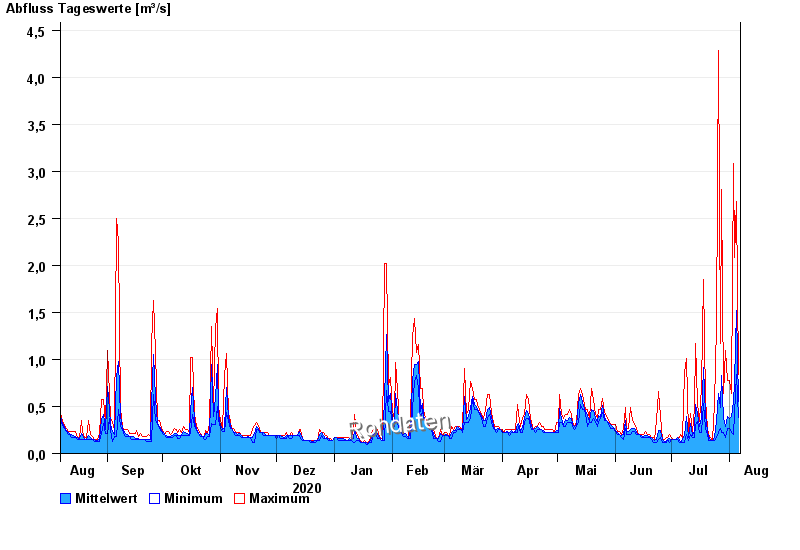
| Date | Mean value [m³/s] | Maximum [m³/s] | Minimum [m³/s] |
|---|---|---|---|
| 06.08.2021 | 0.552 | 0.842 | 0.38 |
| 05.08.2021 | 1.52 | 2.68 | 0.842 |
| 04.08.2021 | 0.758 | 2.08 | 0.428 |
| 03.08.2021 | 0.553 | 3.08 | 0.198 |
| 02.08.2021 | 0.393 | 0.642 | 0.226 |
| 01.08.2021 | 0.375 | 0.776 | 0.262 |
| 31.07.2021 | 0.39 | 0.776 | 0.262 |
© Bayerisches Landesamt für Umwelt 2024