
- Start >
- Rivers >
- Discharge >
- Isar >
- Au b. Bad Aibling >
- Chart of year

Chart of year Au b. Bad Aibling / Aubach
Discharge from 07.08.2023 to 06.08.2024
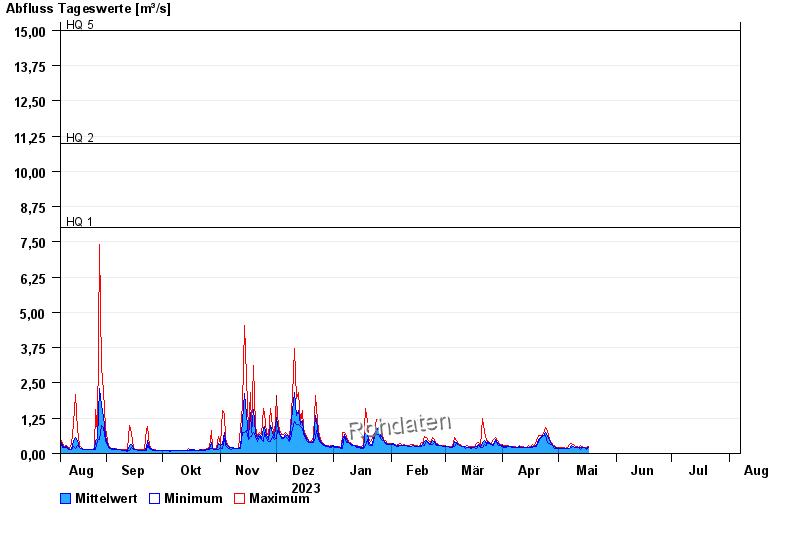
- HQ1 8 m³/s
- HQ2 11 m³/s
- HQ5 15 m³/s
- HQ10 18 m³/s
- HQ20 22 m³/s
- HQ50 25 m³/s
- HQ100 30 m³/s
| Date | Mean value [m³/s] | Maximum [m³/s] | Minimum [m³/s] |
|---|---|---|---|
| 02.05.2024 | 0.178 | 0.206 | 0.177 |
| 01.05.2024 | 0.179 | 0.206 | 0.177 |
| 30.04.2024 | 0.195 | 0.206 | 0.177 |
| 29.04.2024 | 0.234 | 0.273 | 0.177 |
| 28.04.2024 | 0.297 | 0.311 | 0.273 |
| 27.04.2024 | 0.342 | 0.4 | 0.311 |
| 26.04.2024 | 0.445 | 0.507 | 0.354 |
© Bayerisches Landesamt für Umwelt 2024