
- Start >
- Rivers >
- Discharge >
- Isar >
- Au b. Bad Aibling >
- Chart of year

Chart of year Au b. Bad Aibling / Aubach
Discharge from 07.08.2019 to 06.08.2020
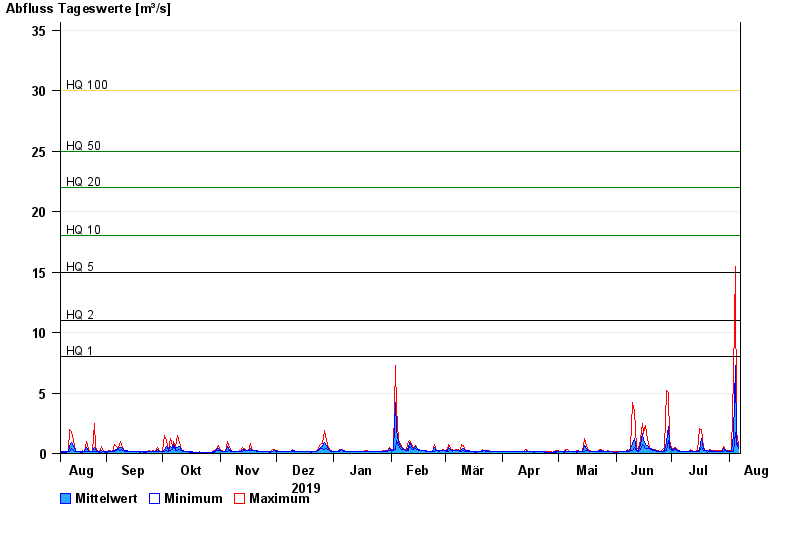
- HQ1 8 m³/s
- HQ2 11 m³/s
- HQ5 15 m³/s
- HQ10 18 m³/s
- HQ20 22 m³/s
- HQ50 25 m³/s
- HQ100 30 m³/s
| Date | Mean value [m³/s] | Maximum [m³/s] | Minimum [m³/s] |
|---|---|---|---|
| 06.08.2020 | 0.563 | 0.736 | 0.432 |
| 05.08.2020 | 1.08 | 1.7 | 0.735 |
| 04.08.2020 | 7.31 | 15.5 | 1.7 |
| 03.08.2020 | 1.6 | 6.49 | 0.192 |
| 02.08.2020 | 0.195 | 0.223 | 0.192 |
| 01.08.2020 | 0.194 | 0.256 | 0.191 |
| 31.07.2020 | 0.21 | 0.222 | 0.19 |
© Bayerisches Landesamt für Umwelt 2024