

Chart of year Aßling / Attel
Discharge from 01.01.2020 to 31.12.2020
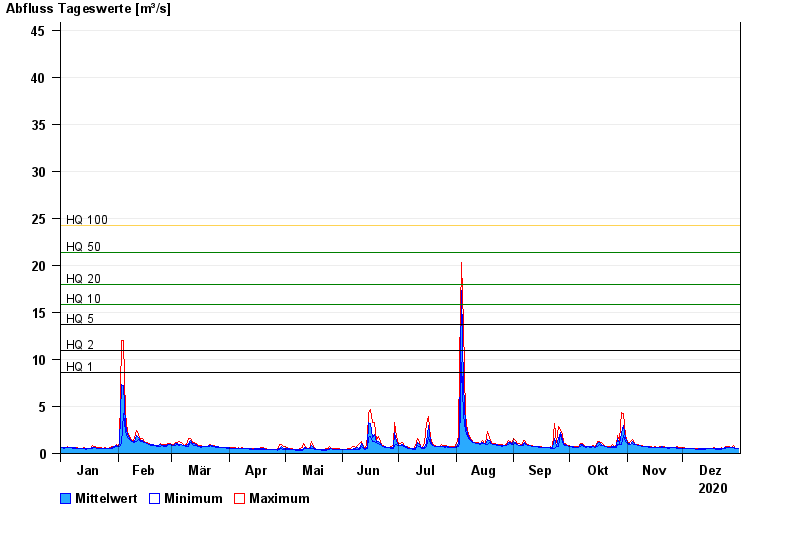
- HQ1 8,6 m³/s
- HQ2 10,9 m³/s
- HQ5 13,7 m³/s
- HQ10 15,8 m³/s
- HQ20 18 m³/s
- HQ50 21,4 m³/s
- HQ100 24,2 m³/s
| Date | Mean value [m³/s] | Maximum [m³/s] | Minimum [m³/s] |
|---|---|---|---|
| 31.12.2020 | 0.555 | 0.567 | 0.514 |
| 30.12.2020 | 0.56 | 0.562 | 0.557 |
| 29.12.2020 | 0.589 | 0.656 | 0.554 |
| 28.12.2020 | 0.639 | 0.874 | 0.598 |
| 27.12.2020 | 0.627 | 0.65 | 0.594 |
| 26.12.2020 | 0.671 | 0.697 | 0.641 |
| 25.12.2020 | 0.665 | 0.692 | 0.634 |
© Bayerisches Landesamt für Umwelt 2024