

Chart of year Anger / Attel
Discharge from 19.06.2023 to 18.06.2024
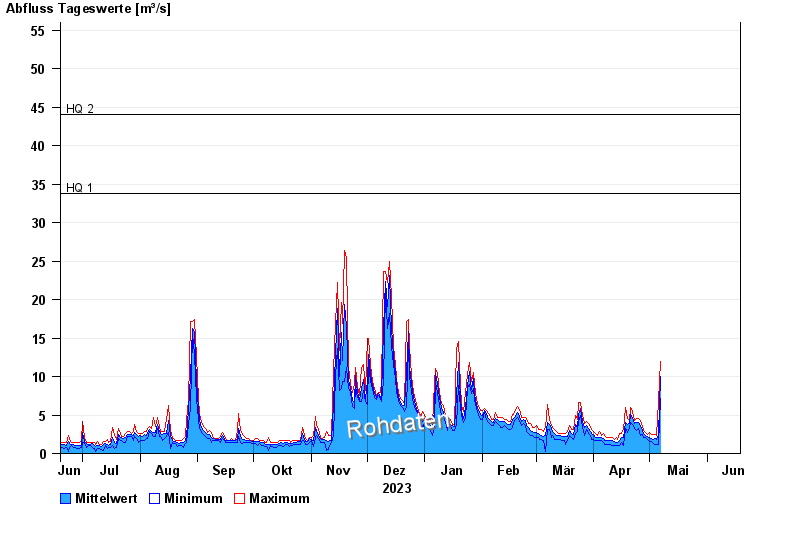
- HQ1 33,8 m³/s
- HQ2 44 m³/s
- HQ5 57,8 m³/s
- HQ10 68,4 m³/s
- HQ20 78,8 m³/s
- HQ50 93,4 m³/s
- HQ100 105 m³/s
| Date | Mean value [m³/s] | Maximum [m³/s] | Minimum [m³/s] |
|---|---|---|---|
| 11.05.2024 | 3.25 | 3.81 | 2.28 |
| 10.05.2024 | 4.02 | 4.86 | 3.29 |
| 09.05.2024 | 5.48 | 5.97 | 4.86 |
| 08.05.2024 | 4.89 | 5.97 | 4.06 |
| 07.05.2024 | 8.48 | 11.9 | 5.14 |
| 06.05.2024 | 2.45 | 6.81 | 1.13 |
| 05.05.2024 | 1.78 | 2.28 | 1.13 |
© Bayerisches Landesamt für Umwelt 2024