

Chart of year Anger / Attel
Discharge from 06.07.2020 to 05.07.2021
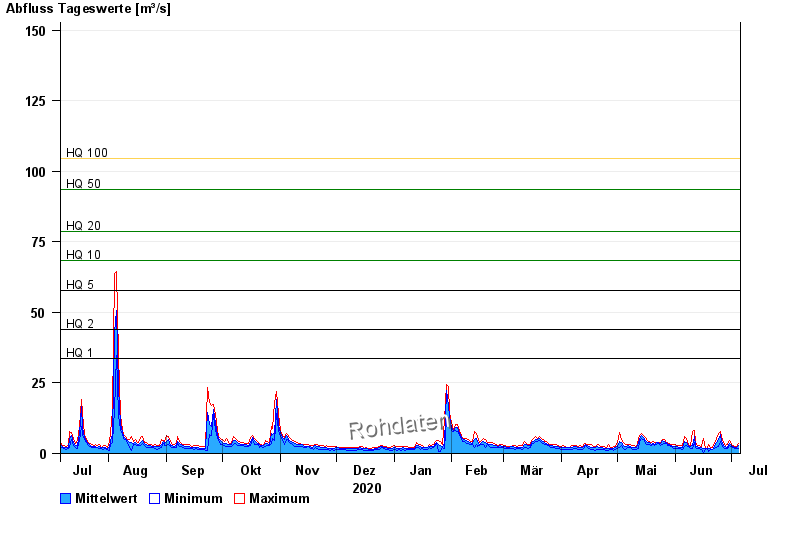
- HQ1 33,8 m³/s
- HQ2 44 m³/s
- HQ5 57,8 m³/s
- HQ10 68,4 m³/s
- HQ20 78,8 m³/s
- HQ50 93,4 m³/s
- HQ100 105 m³/s
| Date | Mean value [m³/s] | Maximum [m³/s] | Minimum [m³/s] |
|---|---|---|---|
| 05.07.2021 | 2.94 | 3.49 | 1.94 |
| 04.07.2021 | 2.2 | 2.45 | 1.69 |
| 03.07.2021 | 2.21 | 2.45 | 1.69 |
| 02.07.2021 | 2.63 | 2.97 | 2.19 |
| 01.07.2021 | 2.94 | 3.22 | 2.45 |
| 30.06.2021 | 3.5 | 4.55 | 2.97 |
| 29.06.2021 | 2.29 | 3.22 | 1.94 |
© Bayerisches Landesamt für Umwelt 2024