

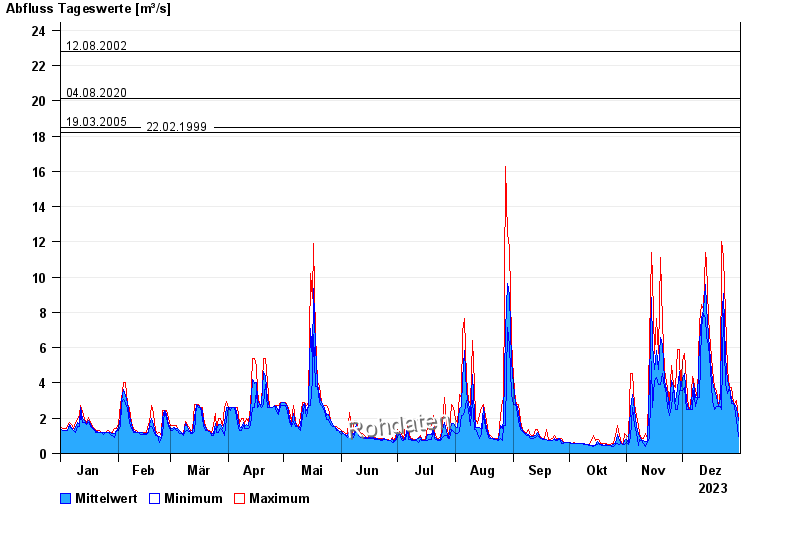
Chart of year Ammerberg / Sur
Discharge from 01.01.2023 to 31.12.2023
- 02.06.2013 Abfluss: 49,7 m³/s
- 12.08.2002 Abfluss: 22,8 m³/s
- 04.08.2020 Abfluss: 20,1 m³/s
- 19.03.2005 Abfluss: 18,5 m³/s
- 22.02.1999 Abfluss: 18,2 m³/s
| Date | Mean value [m³/s] | Maximum [m³/s] | Minimum [m³/s] |
|---|---|---|---|
| 31.12.2023 | 1.88 | 2.02 | 0.963 |
| 30.12.2023 | 2.53 | 3 | 1.88 |
| 29.12.2023 | 2.75 | 2.83 | 2.66 |
| 28.12.2023 | 2.83 | 2.83 | 2.83 |
| 27.12.2023 | 3.13 | 3.76 | 2.83 |
| 26.12.2023 | 3.76 | 3.76 | 3.76 |
| 25.12.2023 | 4.16 | 4.77 | 3.38 |
© Bayerisches Landesamt für Umwelt 2024