

Chart of year Aham / Vils
Discharge from 28.11.2020 to 27.11.2021
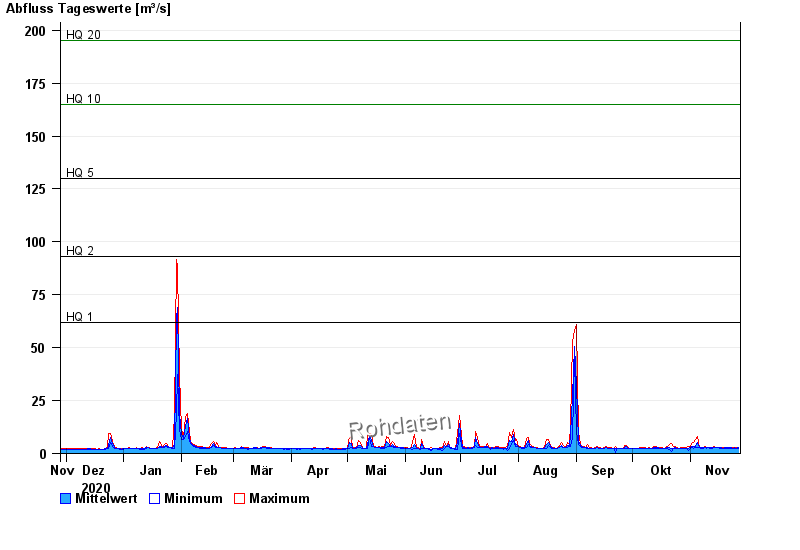
- HQ1 62 m³/s
- HQ2 93 m³/s
- HQ5 130 m³/s
- HQ10 165 m³/s
- HQ20 195 m³/s
- HQ50 243 m³/s
- HQ100 280 m³/s
| Date | Mean value [m³/s] | Maximum [m³/s] | Minimum [m³/s] |
|---|---|---|---|
| 27.11.2021 | 2.6 | 2.74 | 2.5 |
| 26.11.2021 | 2.59 | 2.74 | 2.5 |
| 25.11.2021 | 2.6 | 2.74 | 2.5 |
| 24.11.2021 | 2.56 | 2.74 | 2.28 |
| 23.11.2021 | 2.64 | 2.99 | 2.5 |
| 22.11.2021 | 2.6 | 2.74 | 2.5 |
| 21.11.2021 | 2.62 | 2.74 | 2.5 |
© Bayerisches Landesamt für Umwelt 2024