

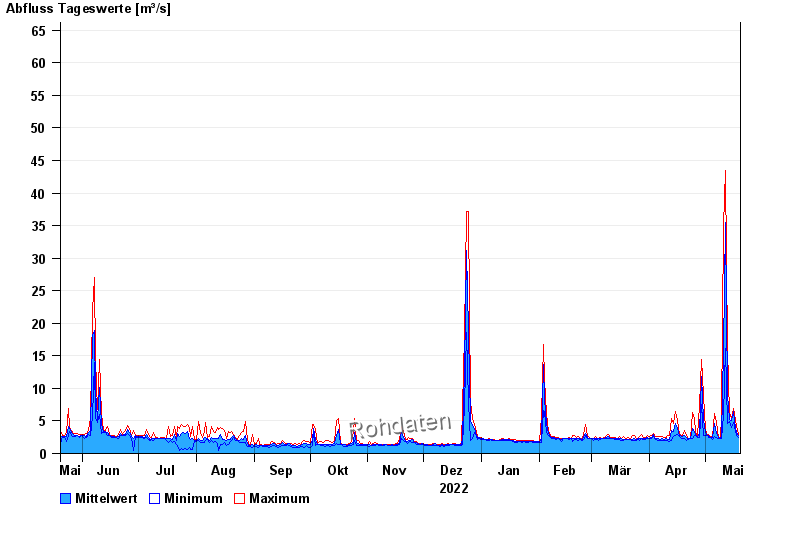
Chart of year Aham / Vils
Discharge from 20.05.2022 to 19.05.2023
- 03.06.2013 Abfluss: 231 m³/s
- 01.02.1985 Abfluss: 197 m³/s
- 04.08.1991 Abfluss: 196 m³/s
- 22.02.1970 Abfluss: 194 m³/s
- 20.02.1999 Abfluss: 176 m³/s
| Date | Mean value [m³/s] | Maximum [m³/s] | Minimum [m³/s] |
|---|---|---|---|
| 19.05.2023 | 2.75 | 2.94 | 2.47 |
| 18.05.2023 | 3.23 | 4.11 | 2.7 |
| 17.05.2023 | 4.9 | 5.94 | 4.11 |
| 16.05.2023 | 6.41 | 6.97 | 4.83 |
| 15.05.2023 | 5.04 | 5.45 | 3.97 |
| 14.05.2023 | 5.28 | 6.28 | 4.98 |
| 13.05.2023 | 9.04 | 15.9 | 4.53 |
© Bayerisches Landesamt für Umwelt 2024