

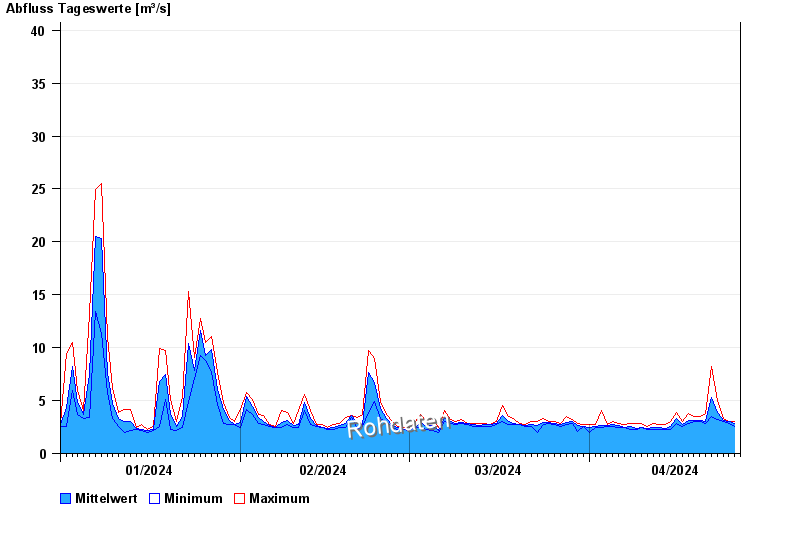
Chart of year Aham / Vils
Discharge from 01.01.2024 to 26.04.2024
- 03.06.2013 Abfluss: 231 m³/s
- 01.02.1985 Abfluss: 197 m³/s
- 04.08.1991 Abfluss: 196 m³/s
- 22.02.1970 Abfluss: 194 m³/s
- 20.02.1999 Abfluss: 176 m³/s
| Date | Mean value [m³/s] | Maximum [m³/s] | Minimum [m³/s] |
|---|---|---|---|
| 26.04.2024 | 3.02 | 3.02 | 3.02 |
| 25.04.2024 | 3.01 | 3.02 | 2.87 |
| 24.04.2024 | 3.12 | 3.31 | 3.02 |
| 23.04.2024 | 3.9 | 5 | 3.17 |
| 22.04.2024 | 5.33 | 8.24 | 3.46 |
| 21.04.2024 | 3.07 | 3.76 | 2.87 |
| 20.04.2024 | 3.09 | 3.46 | 3.02 |
© Bayerisches Landesamt für Umwelt 2024