

Chart of year Achsheim / Schmutter
Discharge from 06.06.2024 to 05.06.2025
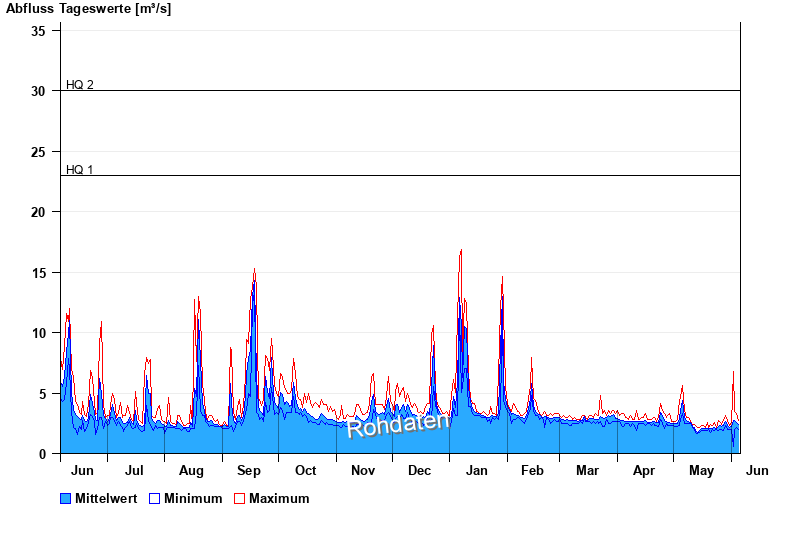
- HQ1 23 m³/s
- HQ2 30 m³/s
- HQ5 43 m³/s
- HQ10 53 m³/s
- HQ20 62 m³/s
- HQ50 77 m³/s
- HQ100 88 m³/s
| Date | Mean value [m³/s] | Maximum [m³/s] | Minimum [m³/s] |
|---|---|---|---|
| 27.07.2024 | 2.3 | 2.44 | 2.27 |
| 26.07.2024 | 2.61 | 2.98 | 1.8 |
| 25.07.2024 | 2.86 | 3.18 | 2.11 |
| 24.07.2024 | 5.02 | 7.89 | 2.27 |
| 23.07.2024 | 5.04 | 7.57 | 2.61 |
| 22.07.2024 | 6.59 | 7.89 | 4.02 |
| 21.07.2024 | 2.19 | 4.25 | 1.8 |
© Bayerisches Landesamt für Umwelt 2024