

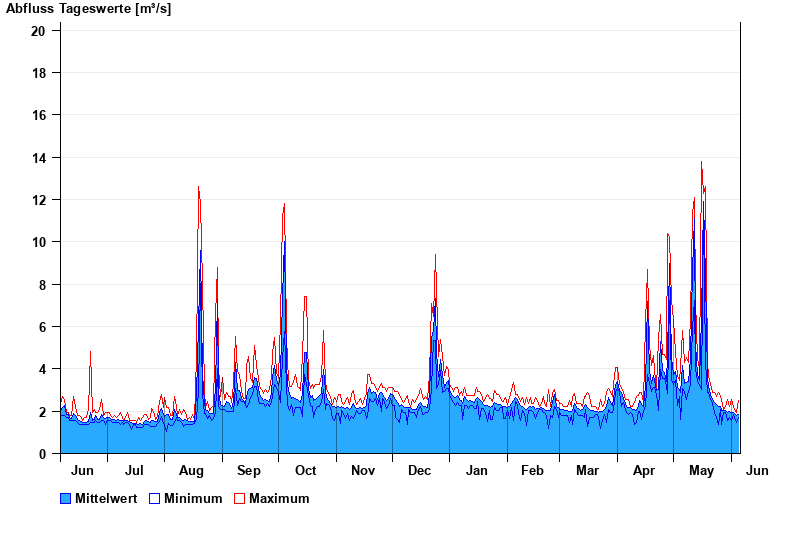
Chart of year Achsheim / Schmutter
Discharge from 06.06.2022 to 05.06.2023
- 01.06.2024 Abfluss: 115 m³/s
- 23.08.2005 Abfluss: 100 m³/s
- 14.04.1994 Abfluss: 64 m³/s
- 22.09.2000 Abfluss: 60,8 m³/s
- 12.08.2002 Abfluss: 60,3 m³/s
| Date | Mean value [m³/s] | Maximum [m³/s] | Minimum [m³/s] |
|---|---|---|---|
| 05.06.2023 | 1.86 | 2.52 | 1.69 |
| 04.06.2023 | 1.78 | 1.94 | 1.47 |
| 03.06.2023 | 1.88 | 2.08 | 1.69 |
| 02.06.2023 | 1.93 | 2.22 | 1.82 |
| 01.06.2023 | 1.92 | 2.53 | 1.58 |
| 31.05.2023 | 2 | 2.22 | 1.7 |
| 30.05.2023 | 1.95 | 2.53 | 1.58 |
© Bayerisches Landesamt für Umwelt 2025