

Chart of year Achsheim / Schmutter
Discharge from 01.01.2022 to 31.12.2022
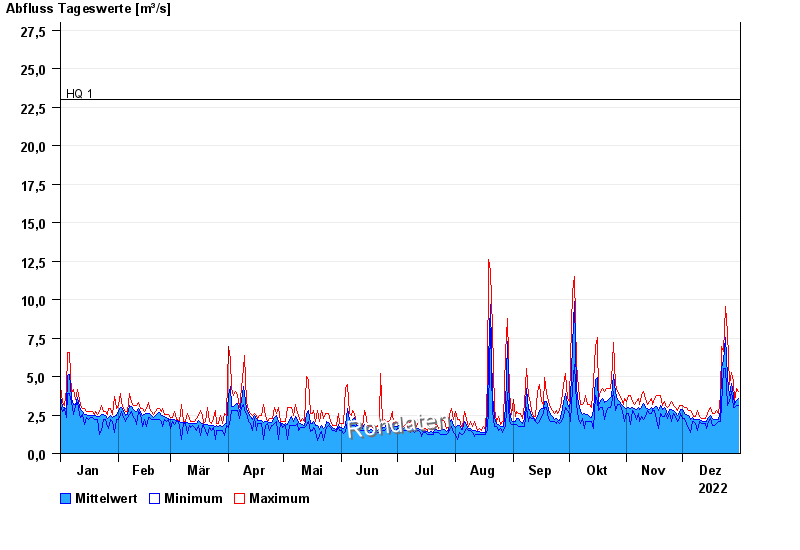
- HQ1 23 m³/s
- HQ2 30 m³/s
- HQ5 43 m³/s
- HQ10 53 m³/s
- HQ20 62 m³/s
- HQ50 77 m³/s
- HQ100 88 m³/s
| Date | Mean value [m³/s] | Maximum [m³/s] | Minimum [m³/s] |
|---|---|---|---|
| 31.12.2022 | 3.57 | 4 | 3.15 |
| 30.12.2022 | 3.45 | 4.23 | 3.15 |
| 29.12.2022 | 3.21 | 3.35 | 2.96 |
| 28.12.2022 | 3.77 | 4.71 | 2.96 |
| 27.12.2022 | 4.56 | 5.23 | 4 |
| 26.12.2022 | 3.75 | 4.46 | 3.35 |
| 25.12.2022 | 4.91 | 7.89 | 3.15 |
© Bayerisches Landesamt für Umwelt 2024