

Chart of year Achsheim / Schmutter
Discharge from 01.01.2019 to 31.12.2019
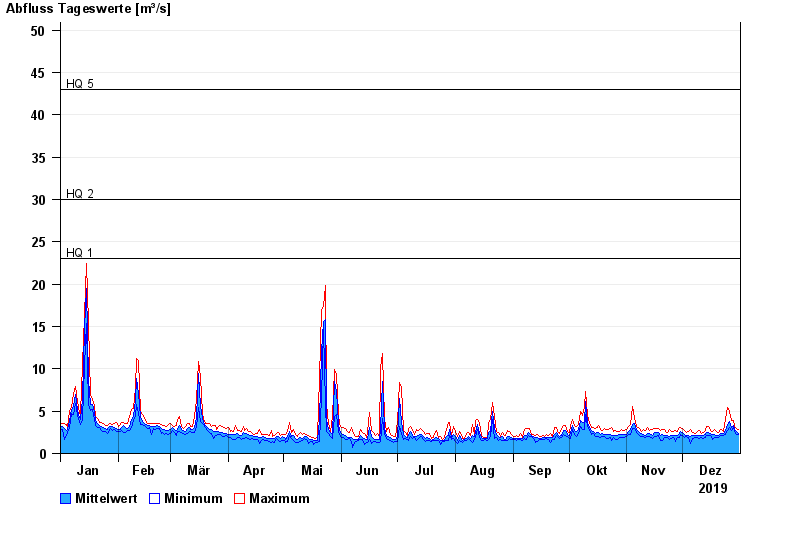
- HQ1 23 m³/s
- HQ2 30 m³/s
- HQ5 43 m³/s
- HQ10 53 m³/s
- HQ20 62 m³/s
- HQ50 77 m³/s
- HQ100 88 m³/s
| Date | Mean value [m³/s] | Maximum [m³/s] | Minimum [m³/s] |
|---|---|---|---|
| 31.12.2019 | 2.39 | 2.8 | 2.19 |
| 30.12.2019 | 2.54 | 2.95 | 2.22 |
| 29.12.2019 | 2.89 | 3.16 | 2.56 |
| 28.12.2019 | 3.36 | 3.84 | 3.05 |
| 27.12.2019 | 3.13 | 3.84 | 2.76 |
| 26.12.2019 | 3.74 | 4.98 | 3.1 |
| 25.12.2019 | 3.48 | 5.43 | 2.69 |
© Bayerisches Landesamt für Umwelt 2024