
- Start >
- Rivers >
- Discharge >
- Inn >
- Wernleiten >
- Chart of total period

Chart of total period Wernleiten / Rote Traun
Discharge from 01.11.1925 to 26.04.2024
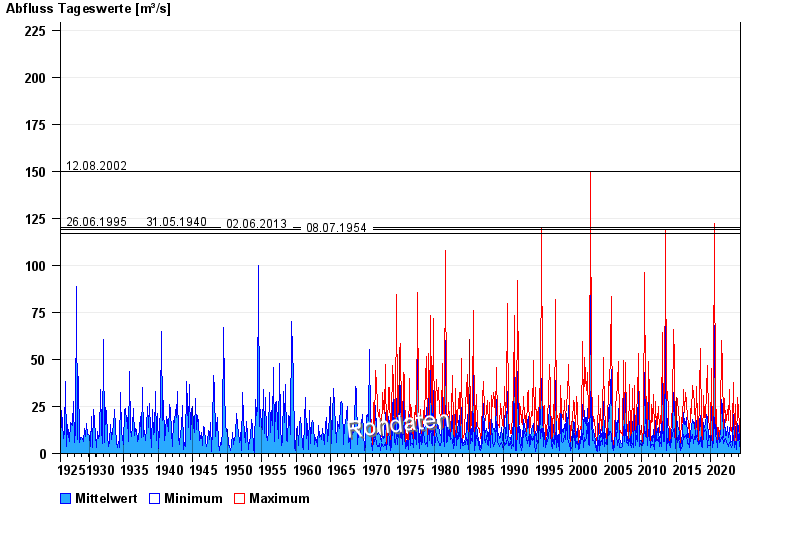
- 12.08.2002 Abfluss: 150 m³/s
- 26.06.1995 Abfluss: 120 m³/s
- 31.05.1940 Abfluss: 120 m³/s
- 02.06.2013 Abfluss: 119 m³/s
- 08.07.1954 Abfluss: 117 m³/s
| Date | Mean value [m³/s] | Maximum [m³/s] | Minimum [m³/s] |
|---|---|---|---|
| 26.04.2024 | 2.42 | 2.97 | 1.89 |
| 25.04.2024 | 2.92 | 3.99 | 2.57 |
| 24.04.2024 | 3.21 | 4.14 | 2.71 |
| 23.04.2024 | 2.86 | 3.39 | 2.57 |
| 22.04.2024 | 3.82 | 4.95 | 3.39 |
| 21.04.2024 | 4.84 | 6.72 | 3.11 |
| 20.04.2024 | 5.62 | 6.9 | 4.62 |
© Bayerisches Landesamt für Umwelt 2024